Business Case Development for M&A
The business case provides the financial justification for an acquisition, demonstrating that the deal will create shareholder value and generate acceptable returns on investment.
What is an M&A Business Case?
An M&A business case is a comprehensive financial analysis that:
- Quantifies value creation from the acquisition
- Projects financial performance of combined entity
- Calculates ROI and other return metrics
- Demonstrates deal meets hurdle rates
- Identifies key value drivers and risks
- Provides financial scenarios (base, upside, downside)
Purpose: Secure internal approval (Board, IC) by proving the deal makes financial sense.
Business Case Components
1. Transaction Overview
Deal Summary
- Target company name and description
- Deal structure (cash, stock, combination)
- Purchase price and enterprise value
- Financing approach
- Expected close timeline
Deal Economics at a Glance
| Metric | Value |
|---|---|
| Enterprise Value | $[X]M |
| Equity Value | $[X]M |
| EV/Revenue | [X.X]x |
| EV/EBITDA | [X.X]x |
| Premium to Market | [X]% |
| Synergy Value | $[X]M |
| Net Purchase Price | $[X]M (EV - Synergies) |
2. Financial Projections
Standalone Projections
Build 5-year standalone forecasts for both:
- Acquirer (current business trajectory)
- Target (based on historical performance + management projections)
Key Assumptions
- Revenue growth rates by segment
- EBITDA margins and operating leverage
- Capex and working capital needs
- Tax rates and NOLs
- D&A and amortization
Use conservative assumptions. Overly aggressive projections undermine credibility and lead to poor investment decisions. Apply haircuts to management's projections (typically 10-20%).
Pro Forma Projections
Combine acquirer + target with adjustments:
- Synergies (revenue and cost)
- Deal costs (one-time integration expenses)
- Purchase accounting impacts (step-up depreciation, goodwill)
- Financing costs (interest on new debt)
3. Synergy Analysis
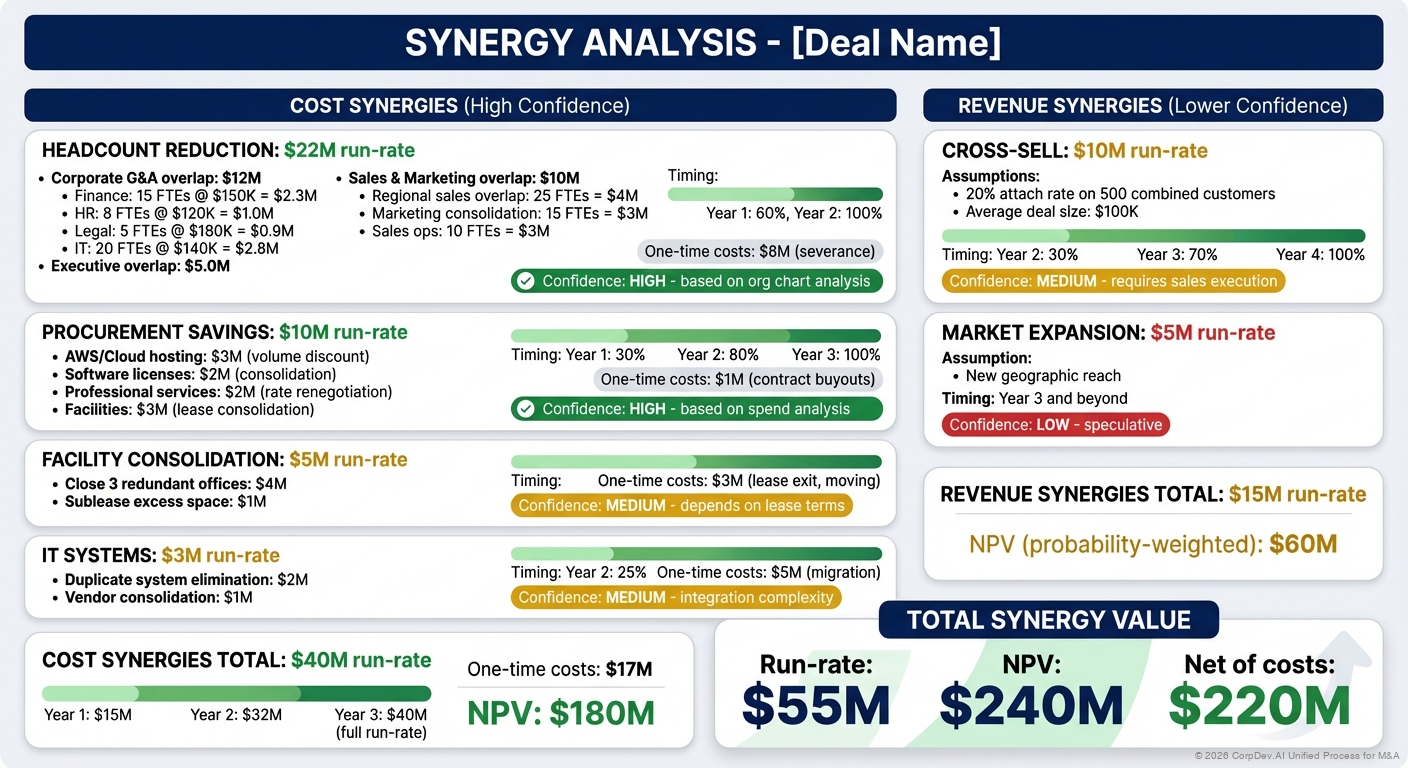
Revenue Synergies
| Source | Year 1 | Year 2 | Year 3 | Steady State | Confidence |
|---|---|---|---|---|---|
| Cross-selling acquirer products to target customers | $[X]M | $[X]M | $[X]M | $[X]M | High/Med/Low |
| Cross-selling target products to acquirer customers | $[X]M | $[X]M | $[X]M | $[X]M | High/Med/Low |
| Price optimization | $[X]M | $[X]M | $[X]M | $[X]M | High/Med/Low |
| New product acceleration | $[X]M | $[X]M | $[X]M | $[X]M | High/Med/Low |
| Total Revenue Synergies | $[X]M | $[X]M | $[X]M | $[X]M |
Cost Synergies
| Source | Year 1 | Year 2 | Year 3 | Steady State | Confidence |
|---|---|---|---|---|---|
| Headcount reduction (overlapping roles) | $[X]M | $[X]M | $[X]M | $[X]M | High |
| Facility consolidation | $[X]M | $[X]M | $[X]M | $[X]M | High |
| Procurement/vendor optimization | $[X]M | $[X]M | $[X]M | $[X]M | Med |
| IT systems consolidation | $[X]M | $[X]M | $[X]M | $[X]M | Med |
| Shared services (HR, Finance, Legal) | $[X]M | $[X]M | $[X]M | $[X]M | Med |
| Marketing/sales efficiency | $[X]M | $[X]M | $[X]M | $[X]M | Med |
| Total Cost Synergies | $[X]M | $[X]M | $[X]M | $[X]M |
Synergy Realization Timeline
- Year 1: [X]% of run-rate synergies
- Year 2: [X]% of run-rate synergies
- Year 3: 100% of run-rate synergies
Cost synergies are more predictable than revenue synergies. Typical approach: underwrite cost synergies conservatively, treat revenue synergies as upside. Board approval should not depend on aggressive revenue synergy assumptions.
Integration Costs
| Category | Cost | Timing |
|---|---|---|
| Severance and retention bonuses | $[X]M | Year 1 |
| Facility closure/lease exit costs | $[X]M | Year 1-2 |
| IT migration and integration | $[X]M | Year 1-2 |
| Professional fees (legal, consulting) | $[X]M | Year 1 |
| Rebranding and marketing | $[X]M | Year 1-2 |
| Other one-time costs | $[X]M | Year 1-2 |
| Total Integration Costs | $[X]M |
Rule of Thumb: Integration costs typically = 10-15% of deal value for transformational deals, 5-10% for bolt-ons.
4. Valuation Analysis
Valuation Methods
Run multiple methodologies to triangulate fair value:
| Method | Implied Value | Weight |
|---|---|---|
| DCF Analysis (WACC-based) | $[X]M - $[X]M | 40% |
| Comparable Companies | $[X]M - $[X]M | 30% |
| Precedent Transactions | $[X]M - $[X]M | 30% |
| Weighted Average | $[X]M | 100% |
Purchase Price Analysis
Purchase Price:              $500M
Less: Synergy PV (3-year):  ($150M)
Net Purchase Price:          $350M

Implied Net Multiples:
- Net EV/Revenue:            2.5x (vs. 3.5x gross)
- Net EV/EBITDA:             8.0x (vs. 11.5x gross)
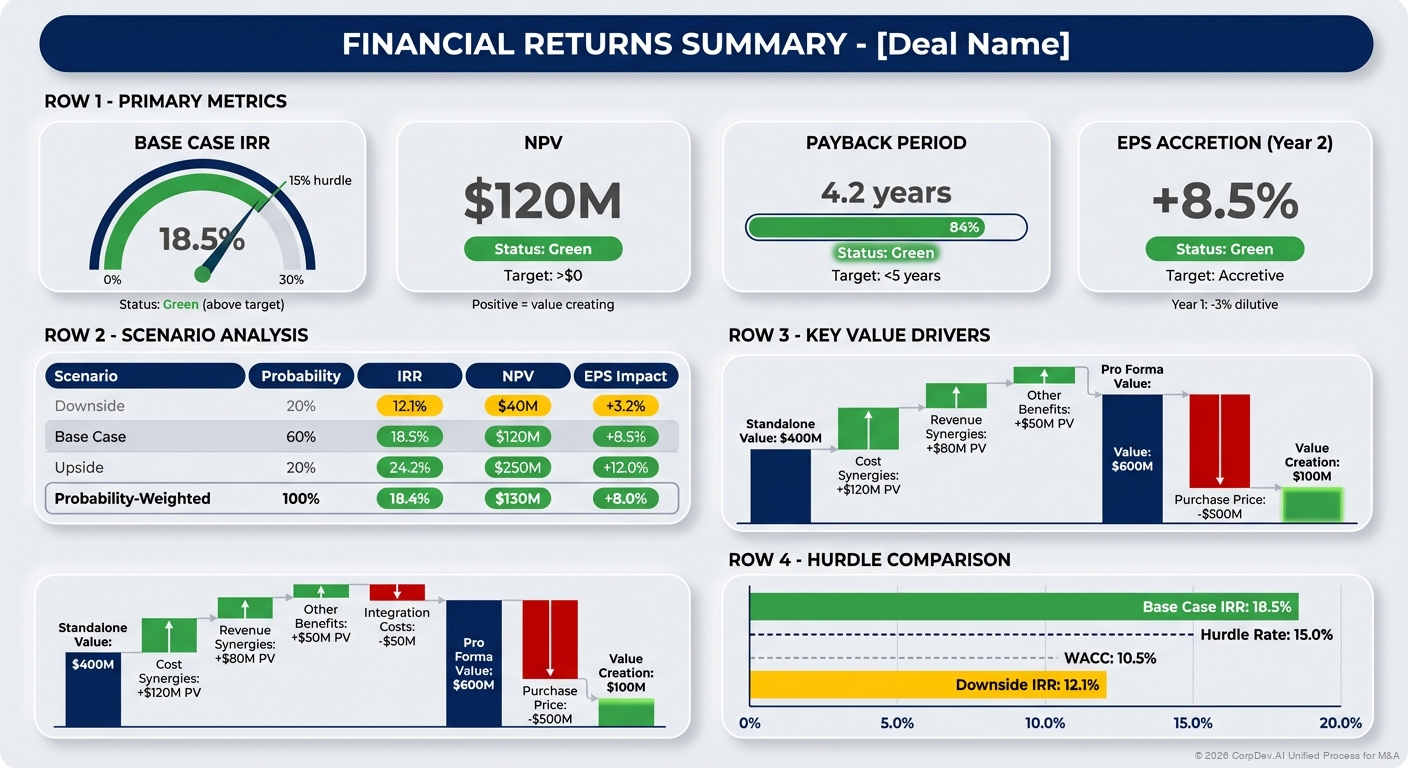
Value Creation Bridge
| Component | Value |
|---|---|
| Target Standalone Value | $400M |
| + Revenue Synergies (PV) | $80M |
| + Cost Synergies (PV) | $120M |
| + Other Benefits (PV) | $50M |
| - Integration Costs (PV) | ($50M) |
| = Total Pro Forma Value | $600M |
| - Purchase Price | ($500M) |
| = Value Creation | $100M |
5. Returns Analysis
Key Return Metrics
| Metric | Target | Base Case | Upside | Downside |
|---|---|---|---|---|
| IRR | >15% | 18.5% | 24.2% | 12.1% |
| Cash ROIC (Year 3) | >WACC+5% | 14.2% | 18.5% | 9.8% |
| NPV | >$0 | $120M | $250M | $40M |
| Payback Period | <5 yrs | 4.2 yrs | 3.1 yrs | 6.5 yrs |
| EPS Accretion (Year 2) | >5% | 8.5% | 12.0% | 3.2% |
IRR Calculation
Year 0:  -$500M (purchase price) - $40M (transaction costs) = -$540M
Year 1:  $45M (incremental FCF)
Year 2:  $75M (incremental FCF)
Year 3:  $95M (incremental FCF)
Year 4:  $110M (incremental FCF)
Year 5:  $125M (incremental FCF) + $600M (terminal value)

IRR = 18.5%
Return Hurdles by Deal Type
| Deal Type | Typical IRR Hurdle | Notes |
|---|---|---|
| Bolt-on acquisition | 15-20% | Lower risk, faster integration |
| Transformational deal | 20-25% | Higher risk premium required |
| Turnaround/distressed | 25%+ | Execution risk, uncertainty |
| Strategic/defensive | 12-15% | Strategic value beyond IRR |
6. Scenario Analysis
Three-Scenario Framework
Build detailed models for each scenario:
Base Case (60% probability)
- Management plan adjusted for conservatism
- 75% of identified synergies achieved
- Market conditions remain stable
- Integration proceeds on schedule
Upside Case (20% probability)
- Strong market tailwinds
- 100%+ synergies captured
- Revenue synergies materialize
- Faster integration
Downside Case (20% probability)
- Market headwinds or recession
- 50% of synergies achieved
- Integration delays/cost overruns
- Customer/employee attrition
Probability-Weighted Returns
Expected IRR = (60% × 18.5%) + (20% × 24.2%) + (20% × 12.1%) = 18.4%
Expected NPV = (60% × $120M) + (20% × $250M) + (20% × $40M) = $130M
Sensitivity Analysis
Test key assumptions:
| Variable | -20% | -10% | Base | +10% | +20% |
|---|---|---|---|---|---|
| Revenue Growth | 14.2% | 16.1% | 18.5% | 20.7% | 23.1% |
| Synergy Capture | 12.8% | 15.8% | 18.5% | 21.0% | 23.2% |
| Multiple on Exit | 15.1% | 16.9% | 18.5% | 19.8% | 21.0% |
| Integration Costs | 19.8% | 19.1% | 18.5% | 17.9% | 17.2% |
Tornado Chart: Identify which variables have greatest impact on returns.
7. Financial Impact
P&L Impact (Pro Forma)
| ($M) | Acquirer Standalone | Target Standalone | Synergies | Pro Forma Combined | % Change |
|---|---|---|---|---|---|
| Revenue | $2,000 | $500 | $50 | $2,550 | +27.5% |
| Gross Profit | $1,200 | $300 | $30 | $1,530 | +27.5% |
| - OpEx | ($800) | ($200) | $80 | ($920) | +15.0% |
| EBITDA | $400 | $100 | $110 | $610 | +52.5% |
| EBITDA Margin | 20.0% | 20.0% | - | 23.9% | +390bps |
Balance Sheet Impact
| ($M) | Pre-Deal | Deal Impact | Post-Deal |
|---|---|---|---|
| Cash | $300 | ($540) | ($240) |
| Goodwill | $500 | $350 | $850 |
| Total Assets | $3,000 | $810 | $3,810 |
| Debt | $800 | $540 | $1,340 |
| Equity | $2,200 | $270 | $2,470 |
| Net Debt | $500 | $780 | $1,280 |
Credit Metrics Impact
| Metric | Pre-Deal | Post-Deal (Year 1) | Target | Year 3 Pro Forma |
|---|---|---|---|---|
| Net Debt/EBITDA | 1.3x | 2.8x | <3.0x | 1.8x |
| EBITDA/Interest | 12.0x | 8.5x | >5.0x | 15.2x |
| FCF/Debt | 25% | 15% | >20% | 28% |
Equity Impact
| Metric | Pre-Deal | Post-Deal Y1 | Post-Deal Y3 |
|---|---|---|---|
| EPS | $2.50 | $2.58 (+3.2%) | $3.25 (+30%) |
| P/E Multiple | 18.0x | 17.5x | 18.0x |
| Share Price | $45.00 | $45.15 | $58.50 |
| Market Cap | $4.5B | $4.5B | $5.9B |
If deal is EPS-dilutive in Years 1-2, prepare strong narrative on long-term value creation and path to accretion. Public company boards are highly sensitive to near-term dilution.
8. Financing Plan
Sources & Uses
| Sources | $M | Uses | $M |
|---|---|---|---|
| Cash on hand | $240 | Purchase price | $500 |
| New debt | $300 | Refinance target debt | $100 |
| - | - | Transaction costs | $40 |
| Total Sources | $540 | Total Uses | $540 |
Financing Strategy
- Maintain investment-grade rating
- Target leverage of 2.5-3.0x Net Debt/EBITDA
- Refi existing revolver to $500M
- Commitment letter from banks secured
- Deleveraging plan: reach <2.0x by Year 3
Building the Business Case: Step-by-Step
Step 1: Gather Inputs
Required Data
- Target financial statements (3-5 years historical)
- Target management projections
- Acquirer financial model
- Market comps and transaction comps
- Synergy estimates from functional teams
- Integration cost estimates
- Financing terms and costs
Step 2: Build Financial Model
Model Structure
- Historical actuals (3-5 years for both companies)
- Standalone projections (5 years for both companies)
- Transaction assumptions (purchase price, structure, financing)
- Purchase price allocation (goodwill, intangibles, step-ups)
- Pro forma adjustments (synergies, integration costs, financing)
- Integrated projections (5 years pro forma P&L, BS, CF)
- Returns calculations (IRR, NPV, ROIC, payback)
- Scenarios (upside, base, downside)
- Sensitivities (key drivers, tornado chart)
Model Best Practices
- Separate assumptions from calculations
- Color code (blue = input, black = formula, green = link)
- Include scenario toggles
- Build circular reference solver for revolver/cash
- Include detailed footnotes and sources
Step 3: Validate Assumptions
Sanity Checks
- Revenue growth rates vs. historical and market growth
- Margins vs. industry benchmarks and historical trends
- Synergies vs. % of revenue/cost base (reasonability)
- Integration costs vs. deal size and complexity
- Valuation multiples vs. comps range
- Return metrics vs. hurdle rates and alternatives
Red Flags
- ❌ Revenue growth >2x historical without clear drivers
- ❌ Margin expansion >500bps without specific initiatives
- ❌ Synergies >30% of target revenue (too aggressive)
- ❌ No integration costs (unrealistic)
- ❌ IRR just barely clears hurdle (no margin of safety)
Step 4: Test Scenarios
Scenario Testing Questions
- What if revenue growth is 50% lower than projected?
- What if synergies are only 50% realized?
- What if integration takes 2x longer and costs 2x more?
- What if we face a recession in Year 2?
- What if key customers leave (customer concentration risk)?
Break-Even Analysis
- What's the minimum synergy capture needed to hit hurdle rate?
- What's the maximum price we can pay and still create value?
- How long can we afford delayed synergy realization?
Step 5: Prepare Recommendation
Investment Committee Memo
## Executive Summary
[2-3 paragraphs summarizing deal, strategic rationale, and financial recommendation]

## Strategic Rationale
[Why this deal makes strategic sense - see Strategic Rationale article]

## Financial Analysis

### Valuation
- Purchase Price: $[X]M
- Implied Multiples: [X.X]x Revenue, [X.X]x EBITDA
- Fair Value Range: $[X]M - $[X]M
- Premium/Discount: [X]%

### Returns
- Base Case IRR: [X]%
- Base Case NPV: $[X]M
- Payback Period: [X] years
- EPS Impact: [X]% accretive in Year 2

### Value Creation
- Total Synergies: $[X]M ($[X]M revenue + $[X]M cost)
- Net Value Creation: $[X]M
- ROIC (Year 3): [X]%

## Risk Assessment
[Key risks and mitigations - see below]

## Financing
[Sources/uses, impact on leverage, credit metrics]

## Recommendation
Recommend approval at purchase price of $[X]M, representing [X.X]x EBITDA multiple and [X]% IRR base case return.
Risk Assessment
Financial Risk Matrix
| Risk | Probability | Impact | Mitigation | Residual Risk |
|---|---|---|---|---|
| Revenue synergies not realized | Medium | High | Conservative base case excludes revenue synergies | Low |
| Integration costs exceed budget | Medium | Medium | 20% contingency in budget; phased approach | Low |
| Customer attrition | Low | High | Retention bonuses; customer communications plan | Medium |
| Talent loss | Medium | Medium | Retention packages for key employees | Low |
| Market downturn | Low | High | Conservative revenue assumptions; stress testing | Medium |
| Regulatory approval delay | Low | Medium | Early engagement with regulators; backup timing | Low |
| Financing market disruption | Low | High | Committed financing; deleveraging plan | Low |
| IT integration complexity | High | Medium | Phased migration; expert consultants engaged | Medium |
Risk Quantification
Model key risks in downside scenario:
- Revenue: -20% vs. base case
- Synergies: -50% vs. base case
- Integration costs: +100% vs. base case
Downside Still Acceptable?
- Downside IRR: [X]% (>12% minimum threshold ✓)
- Downside NPV: $[X]M (>$0 ✓)
- Downside leverage: [X.X]x (Investment grade maintained ✓)
Business Case Checklist
A Strong Business Case:
- Clear value creation story with quantified NPV/IRR
- Conservative assumptions that withstand scrutiny
- Realistic synergies with detailed source-by-source build-up
- Identified integration costs with contingency
- Multiple scenarios showing range of outcomes
- Sensitivity analysis on key value drivers
- Downside protection - acceptable returns even in pessimistic case
- Risk assessment with mitigation plans
- Financing plan that maintains financial flexibility
- Benchmarked returns vs. alternatives (buybacks, capex, other deals)
- Validation from finance, strategy, operations teams
- Board-ready presentation with clear recommendation
Common Mistakes
❌ Pitfalls to Avoid
Over-Optimism
- Using management projections without haircuts
- Aggressive revenue synergy assumptions
- Underestimating integration complexity and costs
- Ignoring implementation risks
Poor Modeling
- Errors in formulas or links
- Inconsistent assumptions across scenarios
- Missing key costs (TSAs, IT migration, retention)
- Circular references not properly handled
Weak Analysis
- Only running base case (no upside/downside)
- Limited sensitivity analysis
- Ignoring competitive response
- Not benchmarking against alternatives
Communication Failures
- Too complex - board can't follow logic
- Missing the "so what" - unclear recommendation
- Ignoring elephant in the room (e.g., EPS dilution)
- Lack of ownership - hedging on recommendation
✓ Best Practices
Be Conservative
- Haircut management projections by 10-20%
- Underwrite cost synergies only for approval
- Include realistic integration costs with contingency
- Stress test with downside scenarios
Show Your Work
- Detail all key assumptions
- Source data and benchmarks
- Build sensitivity and scenario analysis
- Model multiple valuation methods
Tell a Story
- Connect financial analysis to strategic rationale
- Explain how value will be created and captured
- Address risks head-on with mitigation plans
- Make a clear recommendation
Get Validation
- Finance team review of model
- Operating teams validate synergies
- External advisor benchmarking
- Board pre-wires and feedback
Templates & Tools
Business Case Executive Summary Template
# Business Case: [Target Name]

## Deal Overview
- **Target**: [Company name and description]
- **Purchase Price**: $[X]M ([X.X]x Revenue, [X.X]x EBITDA)
- **Structure**: [Cash/Stock/Mix]
- **Timing**: Close expected [Q/Year]

## Strategic Rationale
[2-3 sentences - why this deal makes strategic sense]

## Financial Highlights
| Metric | Value |
|--------|-------|
| **Base Case IRR** | [X]% |
| **NPV** | $[X]M |
| **Payback Period** | [X] years |
| **EPS Impact (Y2)** | [X]% |
| **Synergies (PV)** | $[X]M |

## Value Creation
- Total Value Creation: $[X]M
- Sources: $[X]M cost synergies, $[X]M revenue synergies, $[X]M other
- Net Purchase Multiple: [X.X]x EBITDA (vs. [X.X]x gross)

## Key Risks & Mitigations
1. [Risk #1]: [Mitigation]
2. [Risk #2]: [Mitigation]
3. [Risk #3]: [Mitigation]

## Financing
- **Sources**: $[X]M cash, $[X]M debt
- **Pro Forma Leverage**: [X.X]x (target <[X]x)
- **Credit Profile**: Maintains [investment grade/rating]

## Recommendation
✓ **RECOMMEND APPROVAL** at $[X]M purchase price

[1-2 sentences on why this deal creates value and meets hurdle rates]
Synergy Tracker Template
| Synergy Source | Dept Owner | Year 1 | Year 2 | Year 3 | Run-Rate | Confidence | Status |
|---|---|---|---|---|---|---|---|
| Headcount - Sales overlap | CRO | $2M | $4M | $5M | $5M | High | On track |
| Facility consolidation | CFO | $0 | $3M | $5M | $5M | High | Planning |
| Procurement savings | CPO | $1M | $2M | $3M | $3M | Medium | Analyzing |
| IT systems | CIO | $0 | $1M | $2M | $2M | Medium | Not started |
| Total | $3M | $10M | $15M | $15M |
Example: Business Case Summary
Acquisition of CloudSecure Inc.
Deal Overview
- Purchase Price: $500M ($425M EV + $75M net debt)
- Multiples: 3.5x Revenue, 11.5x EBITDA
- Structure: All cash, financed with $300M debt + $200M cash
Strategic Rationale
Acquire market-leading cloud security platform to complete our cybersecurity suite, enabling us to compete for $500M+ enterprise contracts and accelerate cloud transition.
Financial Returns (Base Case)
- IRR: 18.5% (vs. 15% hurdle)
- NPV: $120M
- Cash ROIC (Year 3): 14.2%
- Payback: 4.2 years
- EPS: 3% dilutive Year 1, 8% accretive Year 2
Value Creation
- Synergies (PV): $150M ($120M cost, $30M revenue)
- Net Purchase Multiple: 8.0x EBITDA (vs. 11.5x gross)
- Total Value Created: $100M NPV
Key Risks
- Customer overlap (15% revenue at risk) - Mitigated by retention plan
- Integration complexity - Mitigated by phased approach, expert advisors
- Debt covenant compliance - Mitigated by committed EBITDA growth, deleveraging plan
Financing
- $300M new term loan (5-year, L+275, investment grade terms)
- Pro forma leverage: 2.8x (delever to 1.8x by Year 3)
- Maintain BBB rating per rating agency pre-wire
Recommendation
✓ APPROVE acquisition at $500M. Deal delivers 18.5% IRR, creates $100M NPV, and accelerates our cloud security strategy by 2-3 years.
Key Takeaways
- Business case = financial proof that deal creates shareholder value
- Conservative assumptions are critical - boards value credibility over optimism
- Synergies must be detailed - source-by-source with ownership and timelines
- Scenario analysis is required - show upside, base, downside with probabilities
- Returns matter - IRR, NPV, ROIC must clear hurdle rates with margin of safety
- Integration costs are real - budget 10-15% of deal value for transformational deals
- Risk assessment matters - identify, quantify, and mitigate key financial risks
- Clear recommendation - don't hedge, make a call supported by analysis
The business case must stand on its own financially. Even with compelling strategic rationale, if the deal doesn't generate acceptable financial returns in a realistic base case scenario, it should not proceed. Strategic value should enhance returns, not justify inadequate returns.
Related Resources
- Deal Thesis Overview - Complete deal thesis framework
- Strategic Rationale - Building strategic justification
- Value Creation Planning - Synergy identification and capture
- DCF Analysis - Intrinsic valuation methodology
- Merger Model - Complete merger model template
© 2026 CorpDev.Ai Unified Process for M&A
Last updated: Thu Oct 30 2025 20:00:00 GMT-0400 (Eastern Daylight Time)