AI & SaaS M&A
The AI and SaaS sectors represent the most active and highest-valuation M&A markets. This guide covers sector-specific strategies, valuation frameworks, and key deal structures with extensive real-world examples.
Market Overview
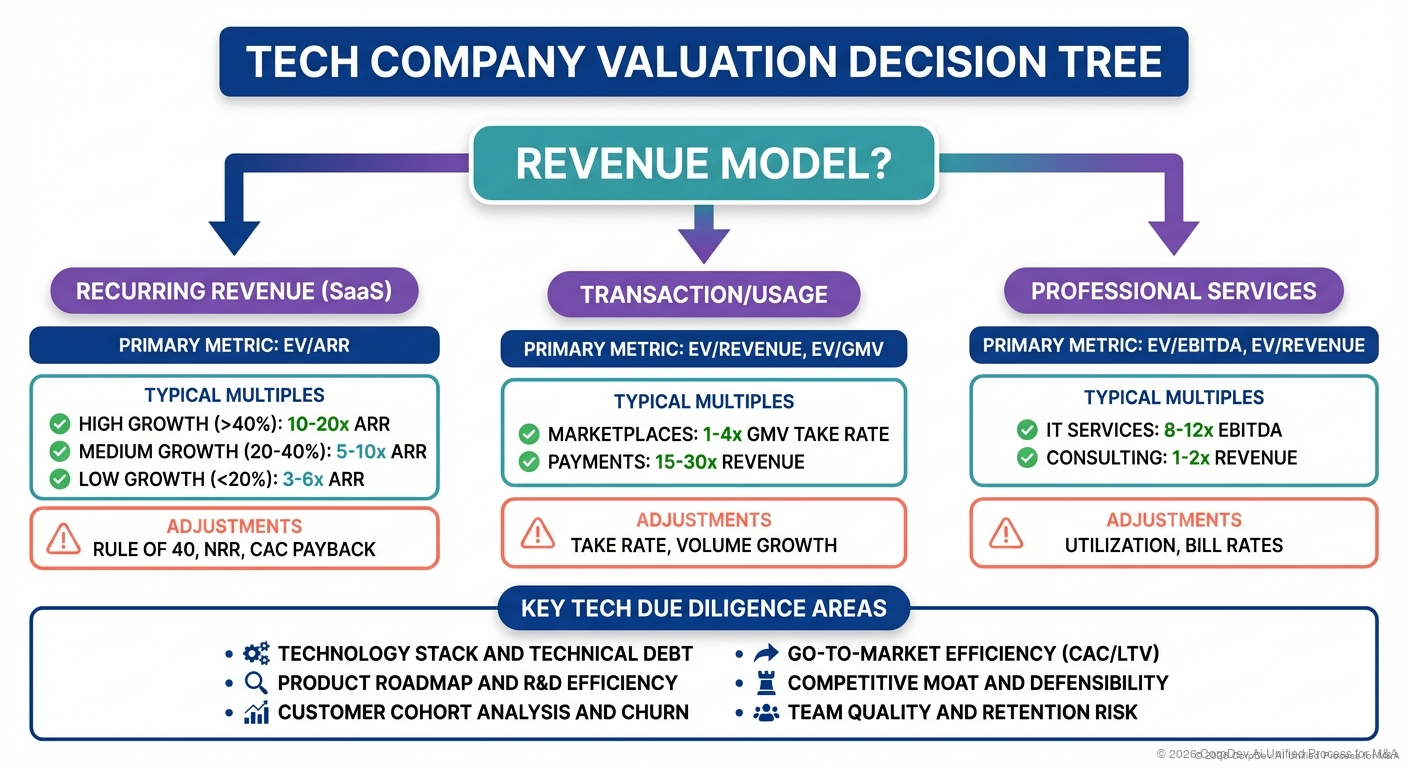
SaaS Valuation Framework
The ARR Multiple Method
Primary Valuation Methodology: Annual Recurring Revenue (ARR) multiples
Base Multiple Determination:
Growth Rate Impact (Primary Driver):
<20% YoY Growth: 2-4x ARR
20-30% YoY: 4-7x ARR
30-50% YoY: 7-12x ARR
50-75% YoY: 12-18x ARR
>75% YoY: 18-30x+ ARR

Profitability Adjustments (Rule of 40):
Rule of 40 = Growth% + FCF Margin%

>60: +3-5x premium
40-60: Market rate
<40: -2-4x discount

Net Revenue Retention (NRR):
>130%: +3-5x premium (best-in-class)
120-130%: +2-3x premium
110-120%: +1-2x premium
100-110%: Base multiple
<100%: -3-5x discount (churning)

Market Position:
Category Leader (>40% share): +2-4x
Strong #2 (#20-40% share): +1-2x
Challenger (<20% share): Base
Declining/Legacy: -3-5x
Complete Example:
Company: Vertical SaaS Platform
ARR: $100M
Growth Rate: 60% YoY
FCF Margin: 5%
Rule of 40: 65
NRR: 125%
Market Position: Category leader (#1, 45% market share)
Gross Margin: 85%

Step-by-Step Valuation:

1. Base Multiple (60% growth): 15x ARR

2. Profitability Adjustment (Rule of 40 = 65): +3x
   Adjusted: 18x ARR

3. NRR Premium (125%): +2x
   Adjusted: 20x ARR

4. Market Position (#1 leader): +2x
   Adjusted: 22x ARR

5. Final Valuation: $100M × 22 = $2.2B

Valuation Range: $2.0B - $2.5B
AI Company Valuation Framework
Different from SaaS: Early revenue, massive TAM potential, talent value
AI Valuation Components:
1. Technology/Model Value:
Factors:
- Model performance vs. benchmarks
- Proprietary training data
- Inference efficiency/cost
- Model architecture advantages
- Patent portfolio

Valuation:
State-of-art model: $50-200M base value
Incremental model: $10-50M base value
Commodity model: $5-10M base value
2. Talent Value (often dominates):
Elite AI Researcher Value: $5-15M per person
Strong Engineer: $2-5M per person
Average Team Member: $500K-1M per person

Example Team Valuation:
5 elite researchers × $10M = $50M
20 strong engineers × $3M = $60M
15 other team members × $750K = $11M
Total Talent Value: $121M

Rule of Thumb: $2-4M per high-quality AI employee
3. Data Assets:
Proprietary Training Data Value:
- Unique dataset: $20-100M+
- Competitive advantage from data
- Difficult/impossible to replicate
- Regulatory moats (healthcare, finance)

Example: Medical imaging AI with 10M labeled scans
- Cost to recreate: $50M+
- Time to recreate: 5+ years
- Regulatory approvals included
- Value: $100M+ for data alone
4. Commercial Traction:
If revenue exists, apply SaaS multiples:
- ARR × growth multiple
- Often 20-50x ARR for high-growth AI

If pre-revenue:
- Pipeline × conversion rate × 10x
- Customer LOIs × 5-10x
- POC value estimation
Complete AI Valuation Example:
Company: Computer Vision AI for Manufacturing

Revenue: $10M ARR (early traction)
Growth: 300% YoY
Team: 40 people (8 PhD researchers, 25 engineers)
Data: Proprietary defect dataset (1M images)
Technology: State-of-art model, 95% accuracy vs 85% competition

Valuation Components:

1. Revenue Multiple: $10M × 25x (300% growth) = $250M

2. Talent Value:
   8 PhD researchers × $8M = $64M
   25 engineers × $3M = $75M
   7 other × $1M = $7M
   Total: $146M

3. Data Asset: $50M (proprietary manufacturing defects)

4. Technology Premium: $30M (SOTA model advantage)

Total Value = MAX(Revenue Multiple, Talent+Data+Tech)
           = MAX($250M, $226M)
           = $250M base

AI Premium (strategic value, platform potential): +$100M

Final Valuation: $350M
Per Person: $8.75M (typical for elite AI company)
Strategic Rationales for SaaS M&A
1. Platform Consolidation (The HubSpot Model)
Strategy: Build comprehensive platform by acquiring point solutions
Real-World Example: HubSpot's Platform Assembly
Vision: All-in-one marketing, sales, and service platform for SMBs
Acquisition Timeline:
2016: Kemvi ($20M est) - Predictive lead scoring (AI)
      - Added AI capabilities early
      - Improved lead qualification

2018: Motion AI ($10M est) - Chatbot platform
      - Conversational marketing
      - Automated customer engagement

2019: PieSync ($7.5M) - Data synchronization
      - App integration platform
      - Eliminated data silos

2020: The Hustle ($27M) - Business newsletter
      - Content/media acquisition
      - Audience building

2021: Clearbit ($150M) - Data enrichment
      - B2B data intelligence
      - Improved targeting and personalization

2023: Cacheflow ($20M est) - Sales enablement
      - Quote-to-cash functionality
Strategic Logic:
Core Platform: Marketing, Sales, Service Hub (built organically)
Acquisitions: Enhance core with AI, data, automation, content

Financial Impact:
Pre-2016: $270M revenue, growing 50%
2024: $2.5B+ revenue, growing 25%

Acquisition Contribution:
- Direct revenue: ~$200M (from acquired products)
- Indirect (improved core platform): ~$500M
- Total contribution: ~$700M (28% of revenue)

Customer Impact:
- ARPU increased 2x ($500/mo → $1,000/mo)
- Products per customer: 1.3 → 2.8
- NRR improved: 98% → 115%
- Churn reduced: 12% → 6%
Key Success Factors:
- Tightly integrated into core platform
- Maintained affordable SMB pricing
- Consistent product experience
- Cross-sell motions built into product
- Free tools drive acquisition funnel
2. The "Land and Expand" Acquisition
Strategy: Acquire companies with high NRR and expansion potential
Example: Twilio's Communication Platform Build
2018: SendGrid ($3B) - Email API
      ARR: $150M
      NRR: 115%
      Growth: 28% YoY
      Logic: Add email to communication platform

      Integration:
      - Maintained brand for 2 years
      - Cross-sold to Twilio base
      - Integrated into Flex platform

      Results (Year 3):
      - SendGrid revenue: $250M (+67%)
      - Cross-sell penetration: 35% of Twilio customers
      - Combined ARPU up 40%

2020: Segment ($3.2B) - Customer data platform
      ARR: $175M
      NRR: 130% (exceptional)
      Growth: 40% YoY
      Logic: Data layer for communication

      Integration Strategy:
      - Keep separate GTM initially
      - Integrate product deeply
      - Build Twilio Engage on Segment

      Expected Results:
      - Segment standalone: $300M ARR (projected)
      - Twilio Engage (built on Segment): $500M+ ARR potential
      - Platform effect: 2x value creation

Strategic Outcome:
- Twilio revenue: $1B (2018) → $4B+ (2024)
- Acquisitions drove 40% of growth
- Transformed from SMS API to customer engagement platform
3. AI Talent Acquisition
Strategy: Acquire AI companies primarily for research teams
Real-World Example: Apple's AI Acqui-Hire Strategy
Strategy: Build AI capabilities through strategic acqui-hires
Acquisition History (2016-2024):
2016: Turi ($200M) - Machine learning platform
      Team: 30 people, several PhD researchers
      Value: $6.7M per person
      Outcome: Became Core ML team

2017: Lattice Data ($200M) - AI for dark data
      Team: 20 people
      Value: $10M per person
      Outcome: Siri intelligence improvements

2018: Silk Labs ($50M est) - On-device AI
      Team: 15 people
      Value: $3.3M per person
      Outcome: Neural Engine development

2019: Xnor.ai ($200M) - Edge AI
      Team: 25 people
      Value: $8M per person
      Outcome: On-device ML improvements

2020: Voysis ($50M est) - Natural language
      Team: 30 people, Dublin-based
      Value: $1.7M per person
      Outcome: Siri improvements

2020: Inductiv ($50-100M est) - Data science automation
      Team: Waterloo researchers
      Outcome: Siri/ML platform

2023: WaveOne ($50M est) - AI video compression
      Team: 10-15 people
      Outcome: Video streaming optimization
Total Investment: ~$1B over 7 years
Total Team Members Acquired: ~150 AI specialists
Average Cost per Person: $6.7M
Strategic Impact:
- Built world-class AI team without poaching
- Acquired specific capabilities (on-device, compression, NLP)
- Technology integrated into iOS/Siri/ML platform
- Avoided public recruiting wars with Google/Microsoft
Integration Pattern:
- Shut down acquired products
- Integrate team into Apple AI
- Technology becomes platform features
- Team stays 3-5 years (typical)
4. Vertical SaaS Roll-Up
Strategy: Consolidate fragmented vertical markets
Example: Vista Equity's Blueprint
Model: Acquire vertical SaaS companies, apply operating playbook, roll-up

Typical Deal Profile:
- Vertical: Legal, Healthcare, Government, etc.
- ARR: $20-100M
- Growth: 15-30%
- Purchase Multiple: 5-8x ARR
- Hold: 4-7 years
- Exit Multiple: 10-15x ARR

Value Creation Levers:
1. Pricing Optimization: +10-20% revenue
2. Sales Efficiency: +15-25% productivity
3. Product Development: Focused roadmap
4. Operating Leverage: +800-1200bps EBITDA margin

Example Portfolio Company Path:
Entry:
- $50M ARR
- 20% growth
- 15% EBITDA margin
- Purchase: $350M (7x ARR)

Vista Operating System Applied:
Year 1: Pricing +15%, margins +5pts
Year 2: Sales efficiency +20%, growth +5pts
Year 3: Operating leverage, margins +10pts total

Exit (Year 5):
- $120M ARR (19% CAGR)
- 25% growth (improved)
- 30% EBITDA margin (+15pts)
- Exit: $1.4B (12x ARR)
- Return: 4x MOIC, 32% IRR

Actual Examples:
- Marketo: $1.8B entry → $4.75B exit (2.6x in 2 years)
- Finastra: Rolled up 5 financial software companies
- Greenway Health: Healthcare vertical consolidation
Landmark AI M&A Deals
1. Microsoft + Nuance Communications ($19.7B, 2021)
Deal Structure:
Target: Nuance Communications
Purchase Price: $19.7B ($56/share, 23% premium)
Revenue: $1.5B
ARR Growth: 8%
Multiple: 13x revenue
Rationale: Healthcare AI + cloud
Strategic Logic:
Why Microsoft Paid Premium for Slow-Growth Company:

1. Healthcare Cloud Strategy:
   - Healthcare is $1T+ cloud opportunity
   - Nuance has 10,000+ healthcare customers
   - 77% of US hospitals use Nuance
   - Entry point into healthcare vertical

2. AI/Voice Technology:
   - 30+ years of voice/NLP IP
   - Medical transcription AI (90% market share)
   - Virtual assistant technology
   - Training data from billions of medical conversations

3. Strategic Defense:
   - Prevent Amazon/Google acquisition
   - Healthcare is strategic priority for all clouds
   - First-mover advantage in healthcare AI

4. Platform Value:
   - Sell Azure to Nuance customers
   - Build healthcare-specific AI models
   - Combine with Teams for healthcare communication
   - Data for training healthcare AI

Financial Justification:
Standalone Value: $10B (based on slow growth)
Strategic Value to Azure Cloud: +$5B
Defensive Value (blocking competition): +$3B
Healthcare AI Platform Value: +$2B
Total Value: $20B

Outcome (Year 3):
- Integrated into Microsoft Cloud for Healthcare
- Azure adoption among Nuance customers: 60%+
- Healthcare cloud revenue: $2B+ (including Nuance)
- Strategic value realized
2. Salesforce + Slack ($27.7B, 2020)
Deal Structure:
Target: Slack Technologies
Purchase Price: $27.7B
Revenue: $900M ARR
Growth: 40% YoY
Multiple: 31x revenue (54% premium)
Structure: $27.7B cash + stock
Strategic Logic:
Why Salesforce Overpaid (Apparently):

Standalone Analysis:
Slack Revenue: $900M
Fair Multiple (40% growth): 15-20x
Fair Value: $13.5-18B
Price Paid: $27.7B
Premium: $10-14B "overpayment"

Strategic Justification:

1. Defensive (Microsoft Teams Threat):
   - Microsoft bundling Teams with Office 365
   - Slack losing enterprise deals to Teams
   - Threat to Salesforce's enterprise presence
   - Defensive value: $5B+

2. Collaboration Platform Play:
   - Salesforce needed workplace collaboration
   - Build vs Buy: 5+ years to build, might fail
   - Time value of speed: $3B+

3. Platform Effects:
   - App integration layer (Slack Connect)
   - Customer communication channel
   - Internal collaboration for Salesforce apps
   - Platform value: $5B+

4. Customer Retention:
   - Stickier platform with collaboration
   - Increased switching costs
   - Higher Net Revenue Retention
   - Retention value: $2B+

Total Strategic Value: $15B
Premium "Overpayment": $10-14B
Strategic Value: $15B
Net: Justified (barely)

Outcome (Year 3):
- Integration ongoing
- Slack integrated into Salesforce workflows
- Cross-sell: 30% of Salesforce customers using Slack
- Microsoft still winning enterprise deals
- Verdict: TBD, likely overpaid but strategic rationale sound
3. Adobe + Figma ($20B, 2022 - BLOCKED)
Deal Structure:
Target: Figma
Proposed Price: $20B
Revenue: $400M ARR
Growth: 100%+ YoY
Implied Multiple: 50x revenue
Status: Blocked by regulators (2023)
Why $20B for $400M ARR Company?
Financial Analysis:
Figma ARR: $400M
Growth: 100%+ YoY
5-Year Revenue Projection: $6B+ ARR
Multiple at Scale: 10-15x
Future Value: $60-90B

DCF to 2027:
Year 1: $800M (100% growth)
Year 2: $1.4B (75% growth)
Year 3: $2.2B (55% growth)
Year 4: $3.2B (45% growth)
Year 5: $4.5B (40% growth)

Terminal Value (10x multiple): $45B
Discount Rate: 12%
PV of Future Cash Flows: $27B

Adobe's Valuation: $20B = 25% discount to intrinsic value

Strategic Logic:

1. Existential Threat:
   - Figma disrupting Adobe's creative cloud
   - Designers switching from Adobe XD to Figma
   - Multiplayer/collaborative design = future
   - Threat to $15B+ creative cloud business

2. Network Effects:
   - 4M users (vs Adobe's 26M)
   - But growing 2x faster
   - Viral adoption in design teams
   - Intercepting next generation of designers

3. Platform Shift:
   - Cloud-native collaborative design
   - Adobe late to this shift
   - Faster to acquire than rebuild
   - Time value: 3-5 years

Defensive Value Analysis:
If Figma continues growing:
- 2027 Figma standalone value: $60B+
- Adobe Creative Cloud cannibalization: -$5B value
- Total cost of not acquiring: $65B+

Therefore $20B acquisition price = 70% discount to cost of not acquiring

Outcome:
- Acquisition blocked by regulators (anti-trust)
- Adobe paid $1B breakup fee
- Figma continuing independent growth
- Adobe building competitive products
- Lesson: Defensive acquisitions face regulatory scrutiny
SaaS-Specific Due Diligence
Financial Metrics Deep Dive
Critical SaaS Metrics to Validate:
1. Annual Recurring Revenue (ARR) Quality:
Components to Verify:
- New ARR (new customers)
- Expansion ARR (upsells)
- Contraction ARR (downgrades)
- Churn ARR (lost customers)
Red Flags:
- High % of ARR from single customer (>10%)
- Non-recurring revenue masked as ARR
- Professional services revenue included
- Contract guarantees not actual usage
- Multi-year contracts front-loaded
Validation:
- Review top 20 customer contracts
- Verify payment history
- Check auto-renewal rates
- Confirm usage vs. contracted amounts
2. Net Revenue Retention (NRR):
Formula:
NRR = (Starting ARR + Expansion - Contraction - Churn) / Starting ARR

Cohort Analysis (Critical):
Must analyze by customer cohort:
- Year 1: Typically 85-95% (deployment phase)
- Year 2: 100-120% (expansion begins)
- Year 3+: 120-140% (mature, expanding)

**Red Flags:**
* [ ] NRR declining quarter-over-quarter
* [ ] Expansion masking high churn
* [ ] Few customers reaching Year 3+
* [ ] Expansion concentrated in few accounts

**Best Practice:**
* [ ] Request 3-year cohort retention analysis
* [ ] Plot NRR by vintage
* [ ] Understand expansion motions

**3. Customer Acquisition Cost (CAC) and Payback:**
CAC = (Sales + Marketing Costs) / New Customers Acquired
CAC Payback Period = CAC / (ACV × Gross Margin)
Benchmarks:
<12 months: Excellent
12-18 months: Good
18-24 months: Acceptable
24 months: Concerning
Deep Dive Required:
- CAC by channel (inbound, outbound, partner)
- CAC by segment (SMB, Mid-Market, Enterprise)
- CAC trend (improving or worsening?)
- Payback by cohort
Red Flags:
- CAC increasing faster than ACV
- Payback period extending
- Heavy discounting to acquire
- High churn in early cohorts (bad CAC:LTV)
4. Logo Retention vs. Dollar Retention:
Logo Retention: % of customers that renew
Dollar Retention (NRR): % of ARR retained + expanded

Example Scenario:
Logo Retention: 85%
NRR: 115%

What this means:
- Losing 15% of customers (concerning)
- But expanding remaining 85% by 35%
- Expansion masking churn

Ideal:
Logo Retention: >90%
NRR: >110%

**Red Flags:**
* [ ] Logo retention <80%
* [ ] Gap between logo and dollar retention >20pts
* [ ] Indicates product/market fit issues

</div>

### Technology Due Diligence for AI Companies

**1. Model Performance Validation:**
* [x] Benchmark against SOTA (state-of-art)
* [x] Test on held-out datasets
* [x] Validate accuracy claims
* [x] Check inference latency/cost
* [x] Evaluate edge cases and failures

**2. Data Quality and Rights:**
* [x] Training data sources and licensing
* [x] Data labeling quality
* [x] Bias testing and mitigation
* [x] Data refresh cadence
* [x] Proprietary vs. public data

**3. Infrastructure and Scalability:**
* [x] Training infrastructure costs
* [x] Inference costs at scale
* [x] Model serving architecture
* [x] Scaling characteristics
* [x] Cloud dependencies and costs

**4. IP and Competitive Moats:**
* [x] Patent portfolio
* [x] Proprietary algorithms
* [x] Data moats
* [x] Model architecture advantages
* [x] Regulatory barriers (FDA, etc.)

**5. Team and Retention:**
* [x] Publication history (top conferences?)
* [x] GitHub contributions
* [x] PhD credentials and advisors
* [x] Previous company experience
* [x] Retention packages and golden handcuffs

## Integration Playbooks

### SaaS Platform Integration (6-12 Months)

**Phase 1: Months 1-3 (Stabilize)**

**Week 1-2: Day 1 Priorities**
* [ ] Customer communication (joint email)
* [ ] Support continuity plan
* [ ] Product roadmap clarity
* [ ] Sales compensation clarity
* [ ] Employee retention packages

**Week 3-4: Quick Wins**
* [ ] SSO integration (if not done)
* [ ] Cross-sell training for sales
* [ ] Joint customer success playbook
* [ ] Marketing integration (website, content)

**Month 2: Technical Planning**
* [ ] API integration design
* [ ] Data sharing architecture
* [ ] Product roadmap integration
* [ ] Sunset/migration planning

**Month 3: Organization Design**
* [ ] Combined team structure
* [ ] Role clarity and redundancy elimination
* [ ] Compensation alignment
* [ ] Office consolidation planning

**Phase 2: Months 4-6 (Integrate)**

**Product Integration:**
* [ ] API connections live
* [ ] Data flowing between products
* [ ] Single sign-on complete
* [ ] Unified billing (if applicable)

**Go-to-Market Integration:**
* [ ] Combined sales pitch
* [ ] Cross-sell quotas and comp
* [ ] Channel partner training
* [ ] Joint marketing campaigns

**Operations Integration:**
* [ ] Finance systems combined
* [ ] HR systems integrated
* [ ] IT infrastructure consolidated
* [ ] Procurement combined

**Phase 3: Months 7-12 (Optimize)**

**Deep Integration:**
* [ ] Product UI/UX consistency
* [ ] Shared services (auth, payments, etc.)
* [ ] Data warehouse integration
* [ ] ML/analytics integration

**Value Capture:**
* [ ] Aggressive cross-sell to both bases
* [ ] Pricing and packaging optimization
* [ ] Upsell and expansion motions
* [ ] Cost synergies (headcount, infrastructure)

**Metrics to Track:**
* [ ] Cross-sell penetration (target: 30-50% by Month 12)
* [ ] ARPU improvement (target: 25-40% increase)
* [ ] NRR improvement (target: +5-10 points)
* [ ] Churn impact (keep flat or improve)

## Common Pitfalls

### 1. Overpaying Based on Growth Alone

**Problem**: High growth without understanding CAC:LTV and unit economics
Example: "Hyper-Growth" SaaS Company
Surface Metrics (Attractive):
- ARR: $50M
- Growth: 150% YoY
- Valuation: $50M × 20x = $1B
Due Diligence Reveals:
- CAC: $50,000
- ACV: $25,000
- CAC Payback: 24 months
- Churn: 30% annually
- LTV:CAC ratio: 1.5:1 (should be >3:1)
Reality:
- Company burning cash to grow
- Unit economics don't work
- Growth unsustainable without subsidy
- True value: $200-300M, not $1B
Lesson: Validate unit economics, not just growth
### 2. Ignoring Integration Complexity

**Problem**: "We'll figure out integration later"
Example: Salesforce + Mulesoft ($6.5B, 2018)
Expectation:
- 6-month integration
- Immediate cross-sell to Salesforce base
- Synergies in Year 1
Reality:
- Integration took 18+ months
- Complex developer product
- Sales reps struggled to position
- Synergies delayed 12+ months
Impact:
- Stock declined post-acquisition
- Lower-than-expected synergies in Years 1-2
- Eventually successful, but rocky start
Lesson: Developer tools and infrastructure products harder to integrate than application software
### 3. Talent Attrition in AI Acquisitions

**Problem**: Key AI talent leaves post-acquisition
Typical Pattern:
Month 1-6: 95%+ retention (honeymoon)
Month 7-12: 85% retention (vesting cliff)
Month 13-24: 70% retention (competition recruiting)
Month 25+: 50% retention (core team leaves)
Example: Google's AI Acqui-Hires
- Many acquired teams have 50%+ attrition by Year 3
- Researchers return to academia or start new companies
- Technology often survives, but momentum lost
Mitigation Strategies:
- 4-year vesting with 1-year cliff minimum
- Retention bonuses at 2 and 3 years
- Research freedom and publication rights
- Competitive compensation (refreshers)
- Interesting problems and resources
- Clear career paths
Best Practice:
Budget for 30-50% attrition and have replacement plan
## Best Practices

<div class="key-takeaways" style="margin: 2rem 0; padding: 1.5rem; background: linear-gradient(135deg, rgba(124, 58, 237, 0.1), rgba(99, 102, 241, 0.1)); border-left: 4px solid #7c3aed; border-radius: 8px;">

### The 10 Commandments of SaaS/AI M&A

1. **Validate Unit Economics**: CAC:LTV must work - growth alone is insufficient

2. **Cohort Analysis is King**: Understand customer retention by vintage, not just aggregate

3. **NRR > Logo Retention**: Dollar retention matters more than customer count

4. **Talent is the Asset**: In AI, pay for team quality - technology is secondary

5. **Integration Complexity**: Developer tools and infrastructure 2-3x harder than apps

6. **Cross-Sell Assumptions**: Validate cross-sell potential with customer interviews

7. **Platform Thinking**: Value how acquisition strengthens overall platform

8. **Retention Packages**: Golden handcuffs essential for AI talent and founders

9. **Speed to Value**: SaaS moves fast - slow integration = missed opportunity

10. **Rule of 40 Matters**: Growth + Profitability = Sustainable business model

</div>

## References

1. [SaaS Valuation Framework - SaaS Capital](https://www.investmentbanking.deloitte.com/en/services/esop-corporate-finance/perspectives/tmt-update.html)
2. [Bessemer Cloud Index - BVP](https://www.investmentbanking.deloitte.com/en/services/esop-corporate-finance/perspectives/tmt-update.html)
3. [AI M&A Trends - CB Insights](https://www.mckinsey.com/capabilities/mckinsey-digital/mckinsey-technology/overview/cybersecurity)
4. [Salesforce M&A Strategy - TechCrunch](https://www.investmentbanking.deloitte.com/en/services/esop-corporate-finance/perspectives/tmt-update.html)
5. [Vista Equity Playbook - Financial Times](https://www.investmentbanking.deloitte.com/en/services/esop-corporate-finance/perspectives/tmt-update.html)
6. [Adobe Figma Analysis - Stratechery](https://www.investmentbanking.deloitte.com/en/services/esop-corporate-finance/perspectives/tmt-update.html)
7. [Microsoft Nuance Deal - GeekWire](https://www.investmentbanking.deloitte.com/en/services/esop-corporate-finance/perspectives/tmt-update.html)
© 2026 CorpDev.Ai Unified Process for M&A
Last updated: Thu Jan 30 2025 19:00:00 GMT-0500 (Eastern Standard Time)