Corporate Development KPIs & Metrics
Measuring the effectiveness of corporate development activities is essential for continuous improvement and demonstrating value to stakeholders. This guide covers the key metrics and KPIs for tracking M&A performance.
Why Metrics Matter
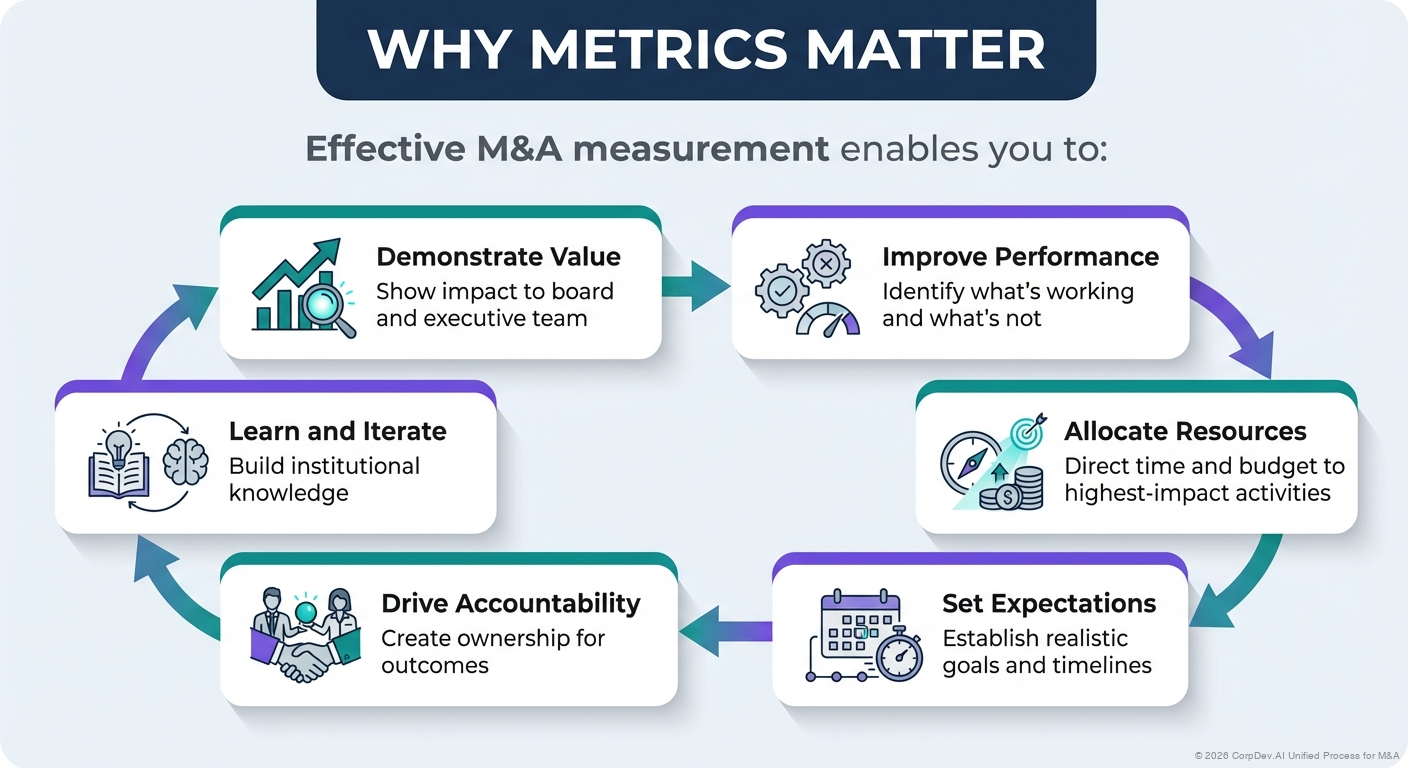
Effective M&A measurement enables you to:
- Demonstrate Value: Show impact to board and executive team
- Improve Performance: Identify what's working and what's not
- Allocate Resources: Direct time and budget to highest-impact activities
- Set Expectations: Establish realistic goals and timelines
- Drive Accountability: Create ownership for outcomes
- Learn and Iterate: Build institutional knowledge
Categories of M&A Metrics
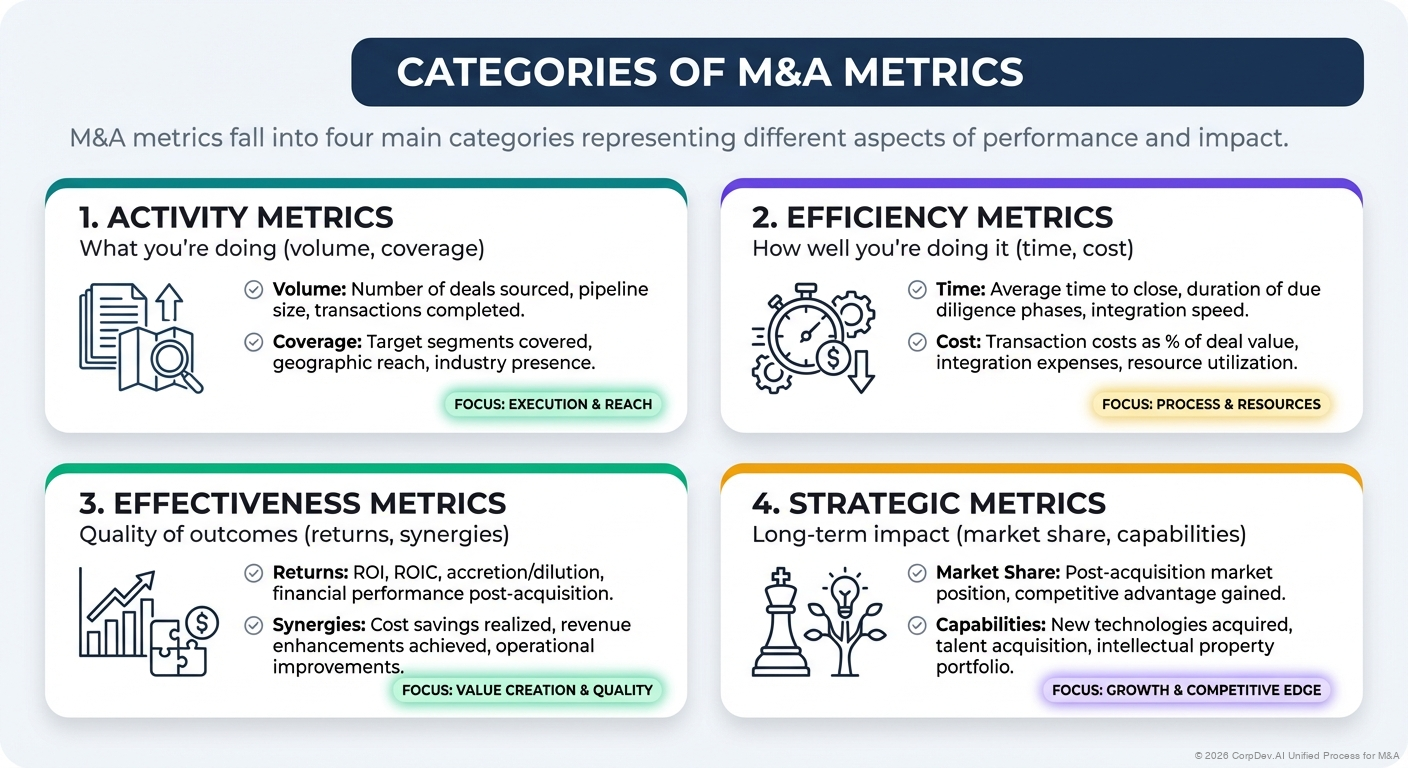
M&A metrics fall into four main categories:
- Activity Metrics: What you're doing (volume, coverage)
- Efficiency Metrics: How well you're doing it (time, cost)
- Effectiveness Metrics: Quality of outcomes (returns, synergies)
- Strategic Metrics: Long-term impact (market share, capabilities)
Activity Metrics
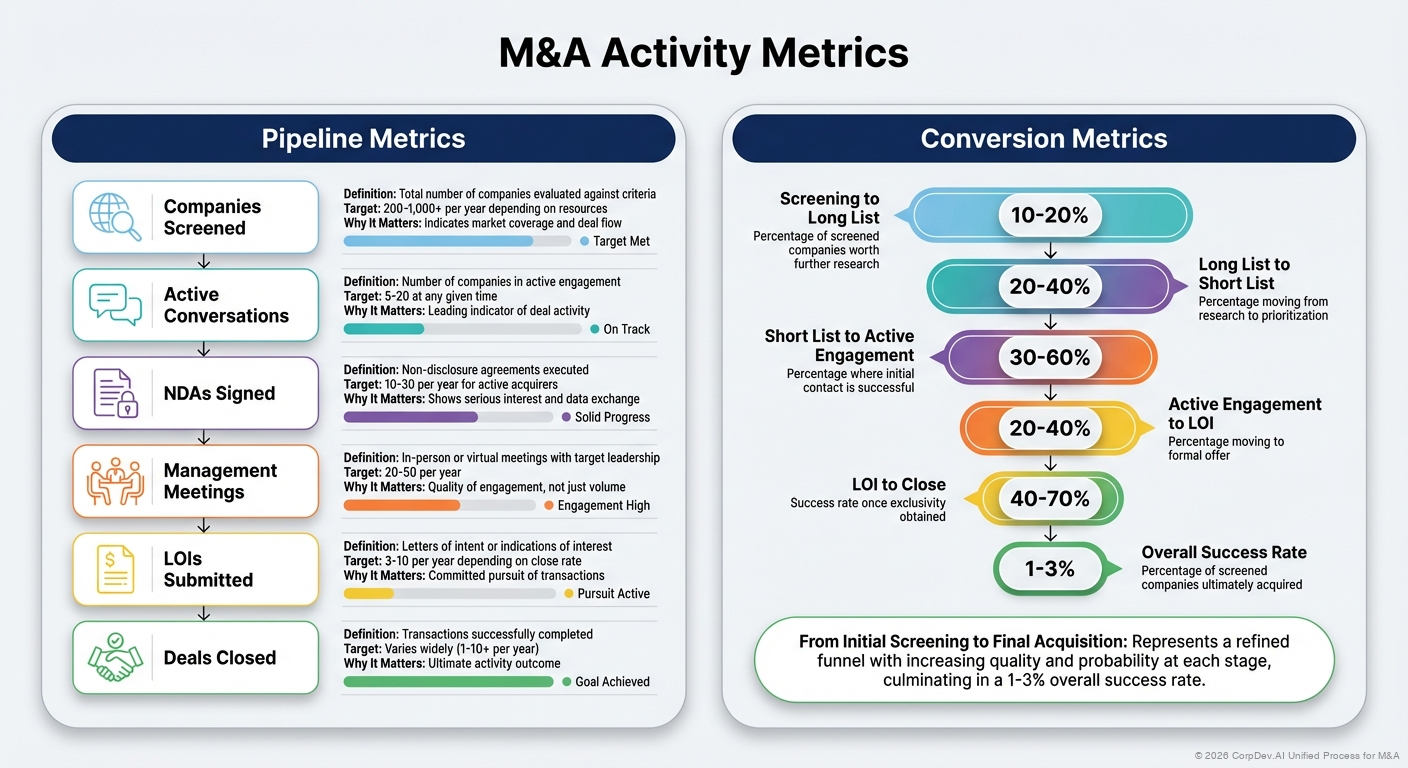
Pipeline Metrics
Companies Screened
- Definition: Total number of companies evaluated against criteria
- Target: 200-1,000+ per year depending on resources
- Why It Matters: Indicates market coverage and deal flow
Active Conversations
- Definition: Number of companies in active engagement
- Target: 5-20 at any given time
- Why It Matters: Leading indicator of deal activity
NDAs Signed
- Definition: Non-disclosure agreements executed
- Target: 10-30 per year for active acquirers
- Why It Matters: Shows serious interest and data exchange
Management Meetings
- Definition: In-person or virtual meetings with target leadership
- Target: 20-50 per year
- Why It Matters: Quality of engagement, not just volume
LOIs Submitted
- Definition: Letters of intent or indications of interest
- Target: 3-10 per year depending on close rate
- Why It Matters: Committed pursuit of transactions
Deals Closed
- Definition: Transactions successfully completed
- Target: Varies widely (1-10+ per year)
- Why It Matters: Ultimate activity outcome
Conversion Metrics
Screening to Long List: 10-20%
- Percentage of screened companies worth further research
Long List to Short List: 20-40%
- Percentage moving from research to prioritization
Short List to Active Engagement: 30-60%
- Percentage where initial contact is successful
Active Engagement to LOI: 20-40%
- Percentage moving to formal offer
LOI to Close: 40-70%
- Success rate once exclusivity obtained
Overall Success Rate: 1-3%
- Percentage of screened companies ultimately acquired
Efficiency Metrics
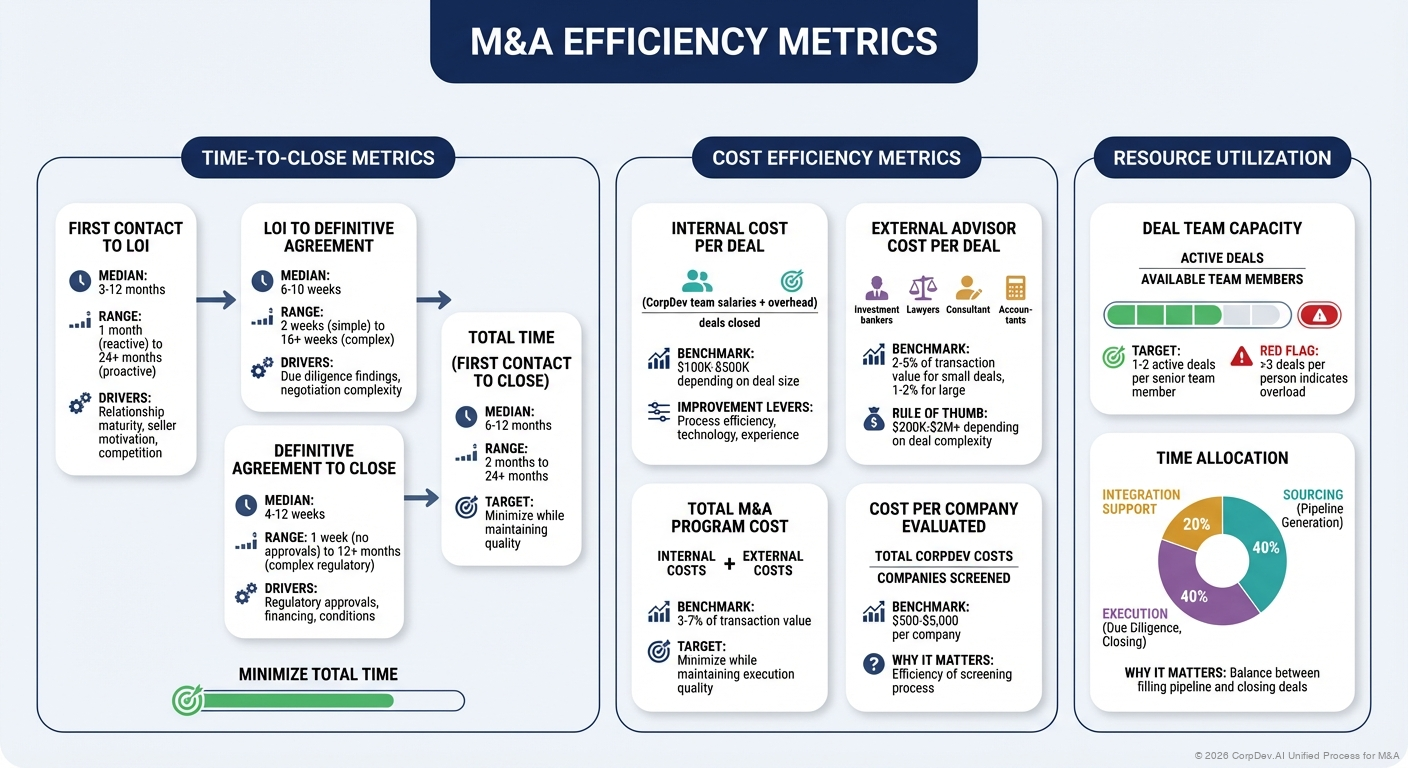
Time-to-Close Metrics
First Contact to LOI
- Median: 3-12 months
- Range: 1 month (reactive) to 24+ months (proactive)
- Drivers: Relationship maturity, seller motivation, competition
LOI to Definitive Agreement
- Median: 6-10 weeks
- Range: 2 weeks (simple) to 16+ weeks (complex)
- Drivers: Due diligence findings, negotiation complexity
Definitive Agreement to Close
- Median: 4-12 weeks
- Range: 1 week (no approvals) to 12+ months (complex regulatory)
- Drivers: Regulatory approvals, financing, conditions
Total Time (First Contact to Close)
- Median: 6-12 months
- Range: 2 months to 24+ months
- Target: Minimize while maintaining quality
Cost Efficiency Metrics
Internal Cost per Deal
- Formula: (CorpDev team salaries + overhead) / deals closed
- Benchmark: $100K-$500K depending on deal size
- Improvement Levers: Process efficiency, technology, experience
External Advisor Cost per Deal
- Components: Investment bankers, lawyers, consultants, accountants
- Benchmark: 2-5% of transaction value for small deals, 1-2% for large
- Rule of Thumb: $200K-$2M+ depending on deal complexity
Total M&A Program Cost
- Formula: Internal costs + external costs
- Benchmark: 3-7% of transaction value
- Target: Minimize while maintaining execution quality
Cost per Company Evaluated
- Formula: Total CorpDev costs / companies screened
- Benchmark: $500-$5,000 per company
- Why It Matters: Efficiency of screening process
Resource Utilization
Deal Team Capacity
- Formula: Active deals / available team members
- Target: 1-2 active deals per senior team member
- Red Flag: >3 deals per person indicates overload
Time Allocation
- Target Mix: 40% sourcing, 40% execution, 20% integration support
- Why It Matters: Balance between filling pipeline and closing deals
Effectiveness Metrics
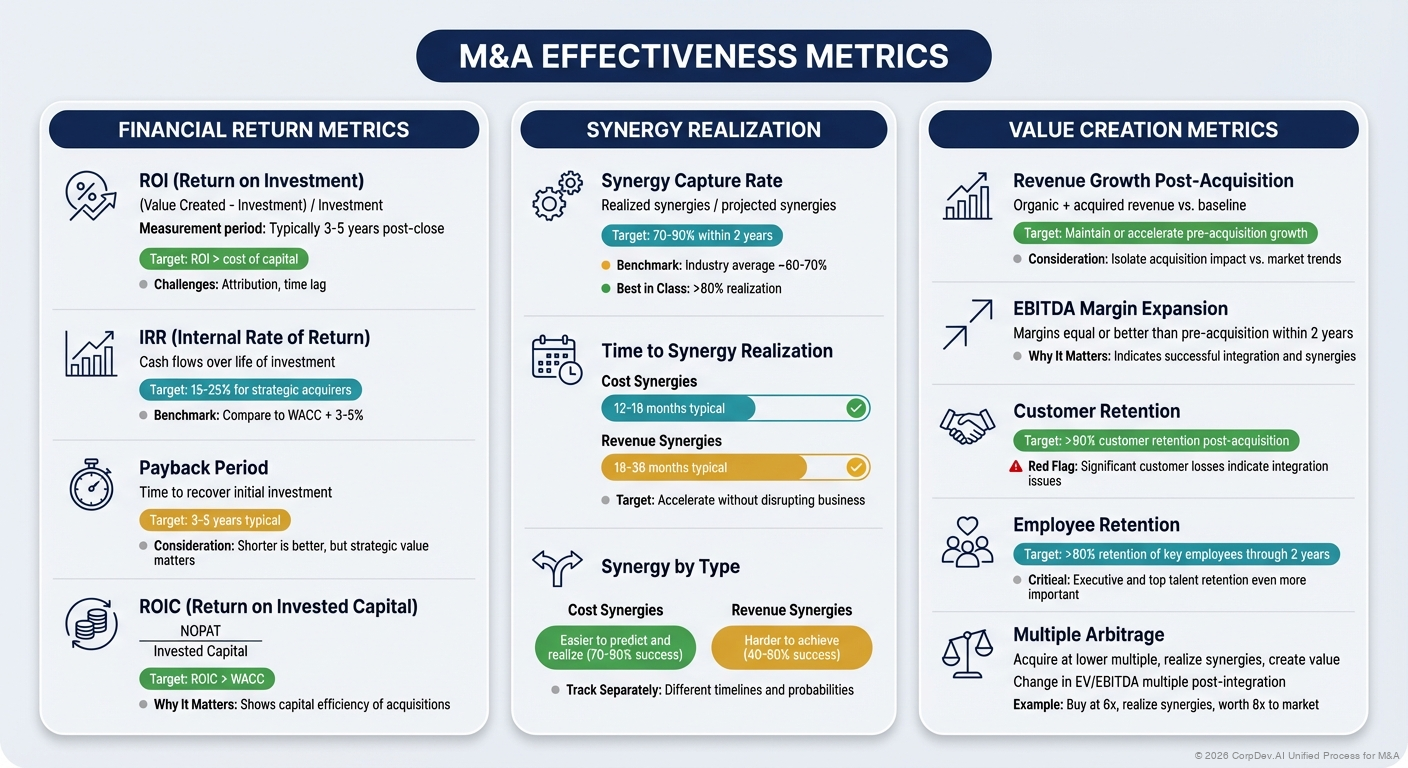
Financial Return Metrics
Return on Investment (ROI)
- Formula: (Value Created - Investment) / Investment
- Measurement Period: Typically 3-5 years post-close
- Target: ROI > cost of capital
- Challenges: Attribution, time lag
Internal Rate of Return (IRR)
- Calculation: Cash flows over life of investment
- Target: 15-25% for strategic acquirers
- Benchmark: Compare to WACC + 3-5%
Payback Period
- Definition: Time to recover initial investment
- Target: 3-5 years typical
- Consideration: Shorter is better, but strategic value matters
ROIC (Return on Invested Capital)
- Formula: NOPAT / Invested Capital
- Target: ROIC > WACC
- Why It Matters: Shows capital efficiency of acquisitions
Synergy Realization
![]()
Synergy Capture Rate
- Formula: Realized synergies / projected synergies
- Target: 70-90% within 2 years
- Benchmark: Industry average ~60-70%
- Best in Class: >80% realization
Time to Synergy Realization
- Cost Synergies: 12-18 months typical
- Revenue Synergies: 18-36 months typical
- Target: Accelerate without disrupting business
Synergy by Type
- Cost Synergies: Easier to predict and realize (70-90% success)
- Revenue Synergies: Harder to achieve (40-60% success)
- Track Separately: Different timelines and probabilities
Value Creation Metrics
Revenue Growth Post-Acquisition
- Measurement: Organic + acquired revenue vs. baseline
- Target: Maintain or accelerate pre-acquisition growth
- Consideration: Isolate acquisition impact vs. market trends
EBITDA Margin Expansion
- Target: Margins equal or better than pre-acquisition within 2 years
- Why It Matters: Indicates successful integration and synergies
Customer Retention
- Target: >90% customer retention post-acquisition
- Red Flag: Significant customer losses indicate integration issues
Employee Retention
- Target: >80% retention of key employees through 2 years
- Critical: Executive and top talent retention even more important
Multiple Arbitrage
- Concept: Acquire at lower multiple, realize synergies, create value
- Measurement: Change in EV/EBITDA multiple post-integration
- Example: Buy at 6x, realize synergies, worth 8x to market
Strategic Metrics
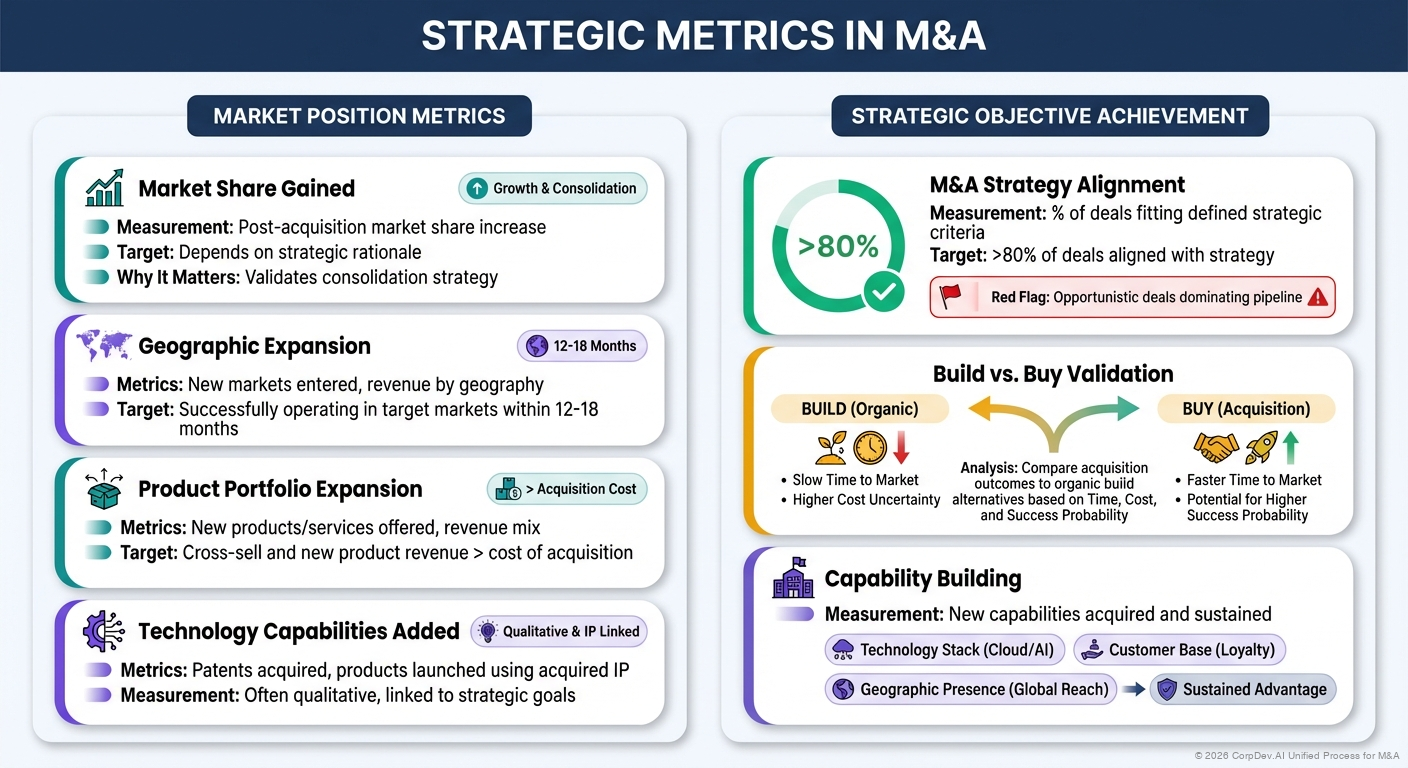
Market Position Metrics
Market Share Gained
- Measurement: Post-acquisition market share increase
- Target: Depends on strategic rationale
- Why It Matters: Validates consolidation strategy
Geographic Expansion
- Metrics: New markets entered, revenue by geography
- Target: Successfully operating in target markets within 12-18 months
Product Portfolio Expansion
- Metrics: New products/services offered, revenue mix
- Target: Cross-sell and new product revenue > cost of acquisition
Technology Capabilities Added
- Metrics: Patents acquired, products launched using acquired IP
- Measurement: Often qualitative, linked to strategic goals
Strategic Objective Achievement
M&A Strategy Alignment
- Measurement: % of deals fitting defined strategic criteria
- Target: >80% of deals aligned with strategy
- Red Flag: Opportunistic deals dominating pipeline
Build vs. Buy Validation
- Analysis: Compare acquisition outcomes to organic build alternatives
- Considerations: Time to market, cost, success probability
Capability Building
- Measurement: New capabilities acquired and sustained
- Examples: Technology stack, customer base, geographic presence
Integration Success Metrics
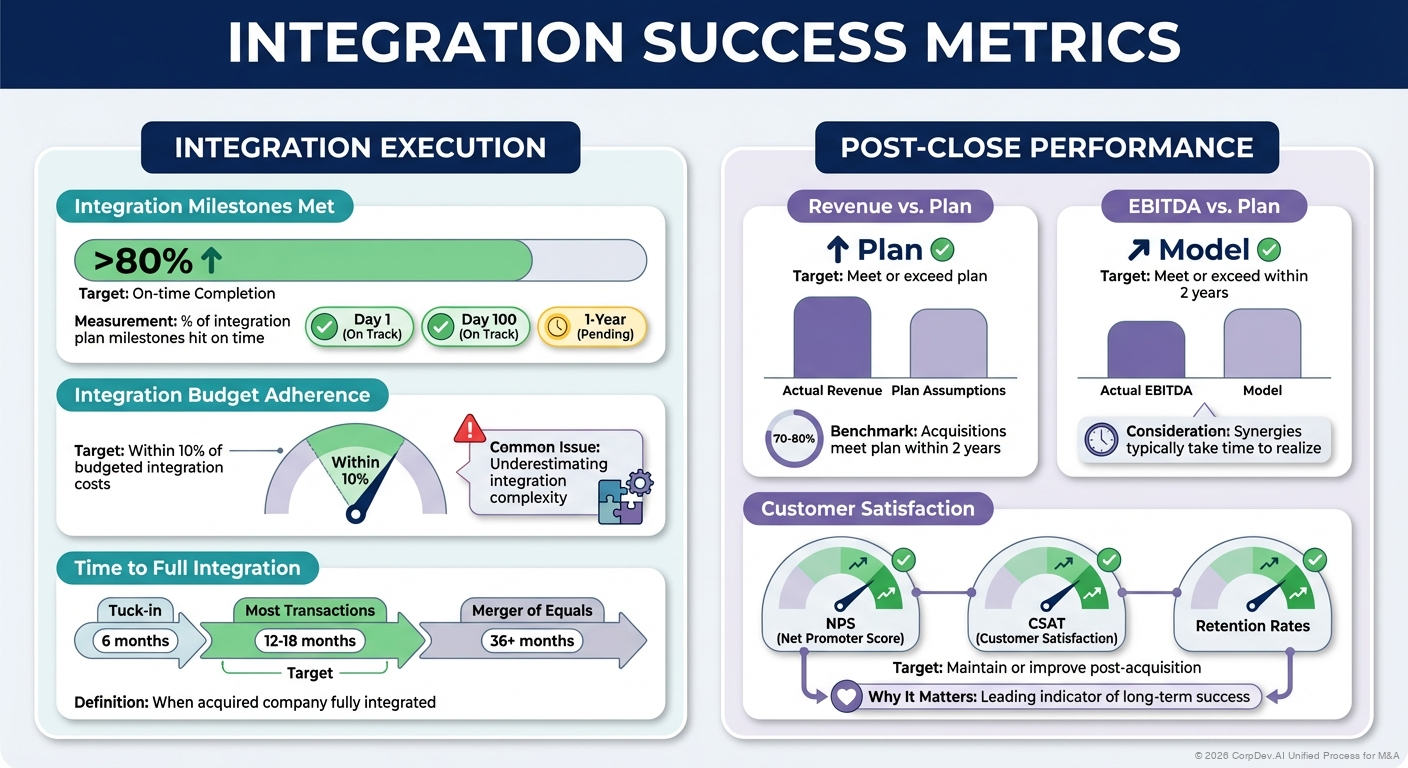
Integration Execution
Integration Milestones Met
- Measurement: % of integration plan milestones hit on time
- Target: >80% on-time completion
- Track: Day 1, Day 100, 1-year milestones
Integration Budget Adherence
- Target: Within 10% of budgeted integration costs
- Common Issue: Underestimating integration complexity
Time to Full Integration
- Definition: When acquired company fully integrated
- Target: 12-18 months for most transactions
- Range: 6 months (tuck-in) to 36+ months (merger of equals)
Post-Close Performance
Revenue vs. Plan
- Measurement: Actual revenue vs. acquisition model assumptions
- Target: Meet or exceed plan
- Benchmark: 70-80% of acquisitions meet plan within 2 years
EBITDA vs. Plan
- Measurement: Actual EBITDA vs. model
- Target: Meet or exceed within 2 years
- Consideration: Synergies typically take time to realize
Customer Satisfaction
- Metrics: NPS, CSAT, retention rates
- Target: Maintain or improve post-acquisition
- Why It Matters: Leading indicator of long-term success
Benchmarking and Targets
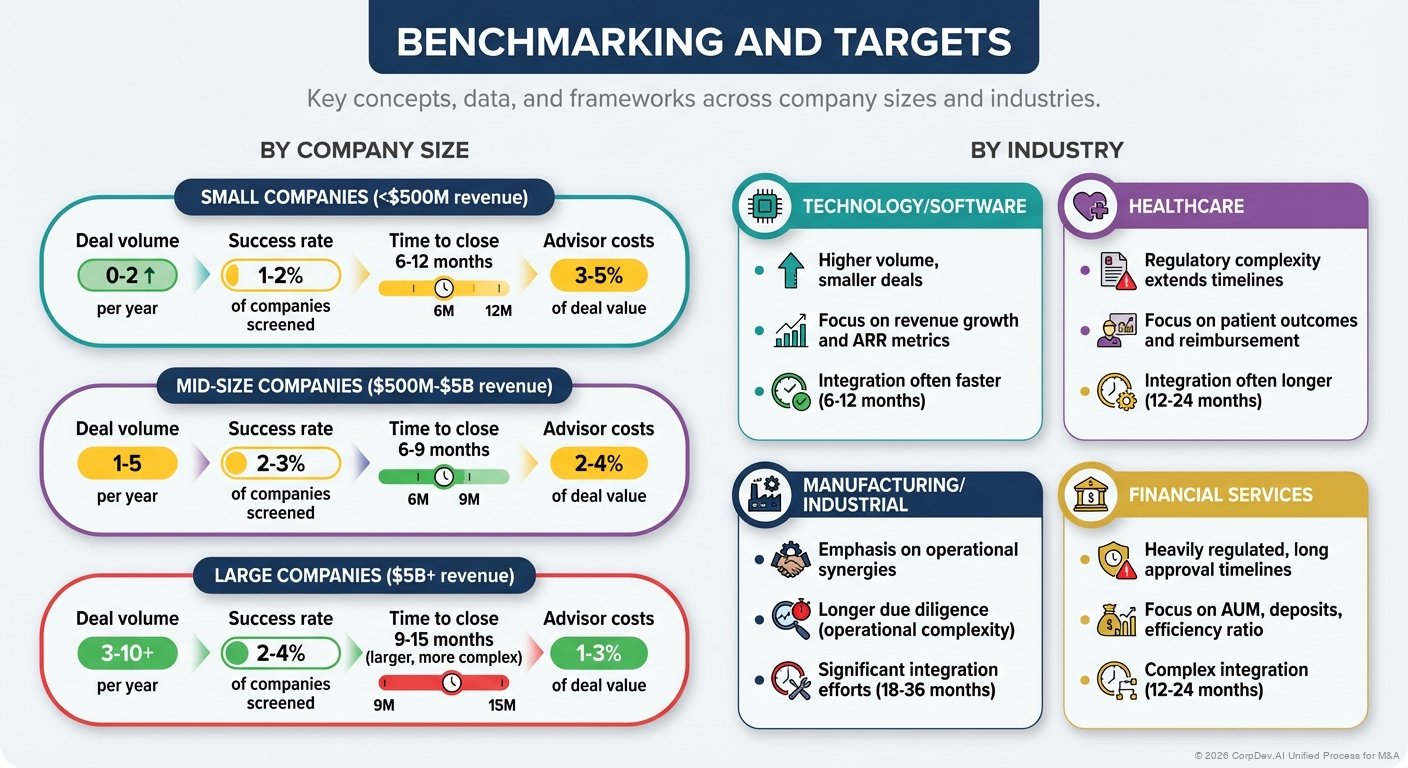
By Company Size
Small Companies (<$500M revenue)
- Deal volume: 0-2 per year
- Success rate: 1-2% of companies screened
- Time to close: 6-12 months
- Advisor costs: 3-5% of deal value
Mid-Size Companies ($500M-$5B revenue)
- Deal volume: 1-5 per year
- Success rate: 2-3% of companies screened
- Time to close: 6-9 months
- Advisor costs: 2-4% of deal value
Large Companies ($5B+ revenue)
- Deal volume: 3-10+ per year
- Success rate: 2-4% of companies screened
- Time to close: 9-15 months (larger, more complex)
- Advisor costs: 1-3% of deal value
By Industry
Technology/Software
- Higher volume, smaller deals
- Focus on revenue growth and ARR metrics
- Integration often faster (6-12 months)
Healthcare
- Regulatory complexity extends timelines
- Focus on patient outcomes and reimbursement
- Integration often longer (12-24 months)
Manufacturing/Industrial
- Emphasis on operational synergies
- Longer due diligence (operational complexity)
- Significant integration efforts (18-36 months)
Financial Services
- Heavily regulated, long approval timelines
- Focus on AUM, deposits, efficiency ratio
- Complex integration (12-24 months)
Building Your M&A Scorecard
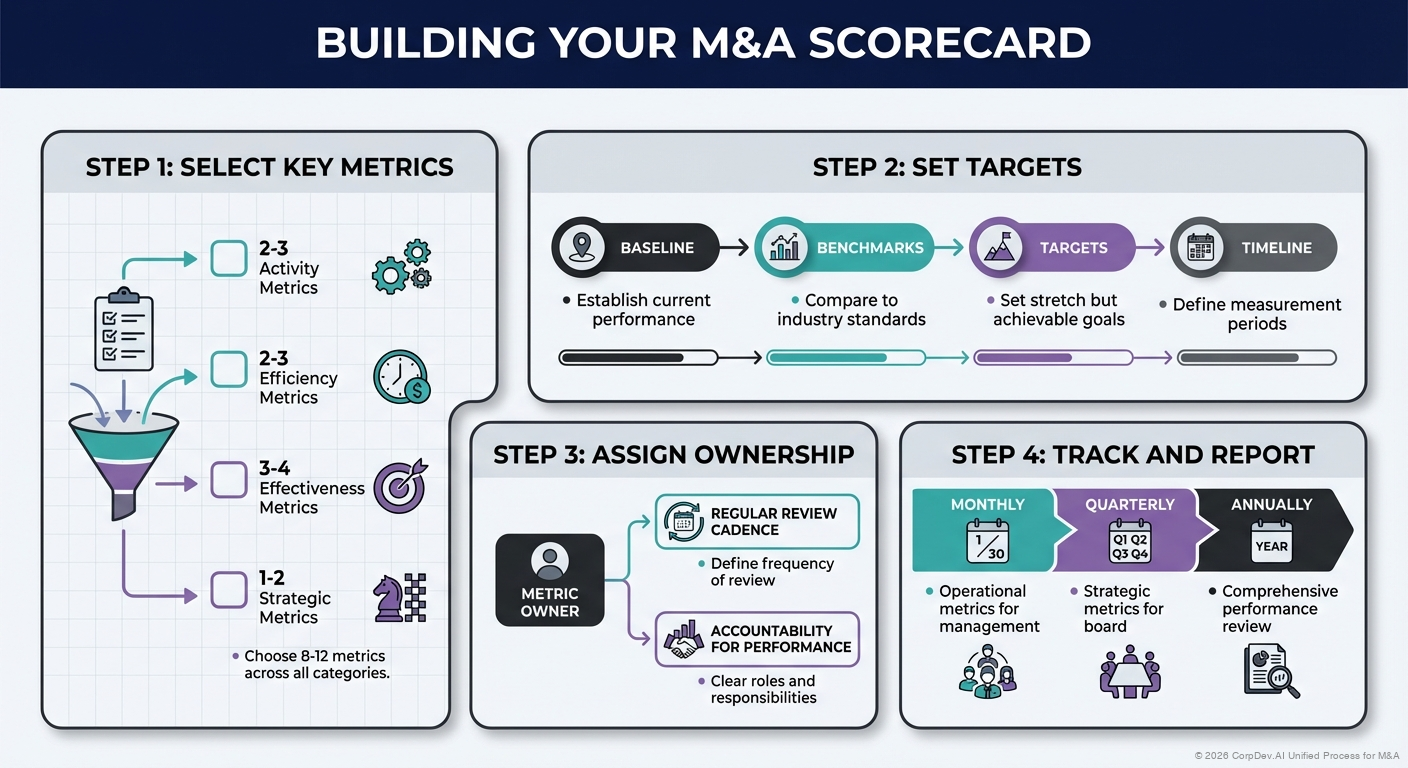
Step 1: Select Key Metrics
Choose 8-12 metrics across all categories:
- 2-3 Activity Metrics
- 2-3 Efficiency Metrics
- 3-4 Effectiveness Metrics
- 1-2 Strategic Metrics
Step 2: Set Targets
- Baseline: Establish current performance
- Benchmarks: Compare to industry standards
- Targets: Set stretch but achievable goals
- Timeline: Define measurement periods
Step 3: Assign Ownership
- Each metric has a clear owner
- Regular review cadence
- Accountability for performance
Step 4: Track and Report
- Monthly: Operational metrics for management
- Quarterly: Strategic metrics for board
- Annually: Comprehensive performance review
Common Pitfalls in M&A Metrics
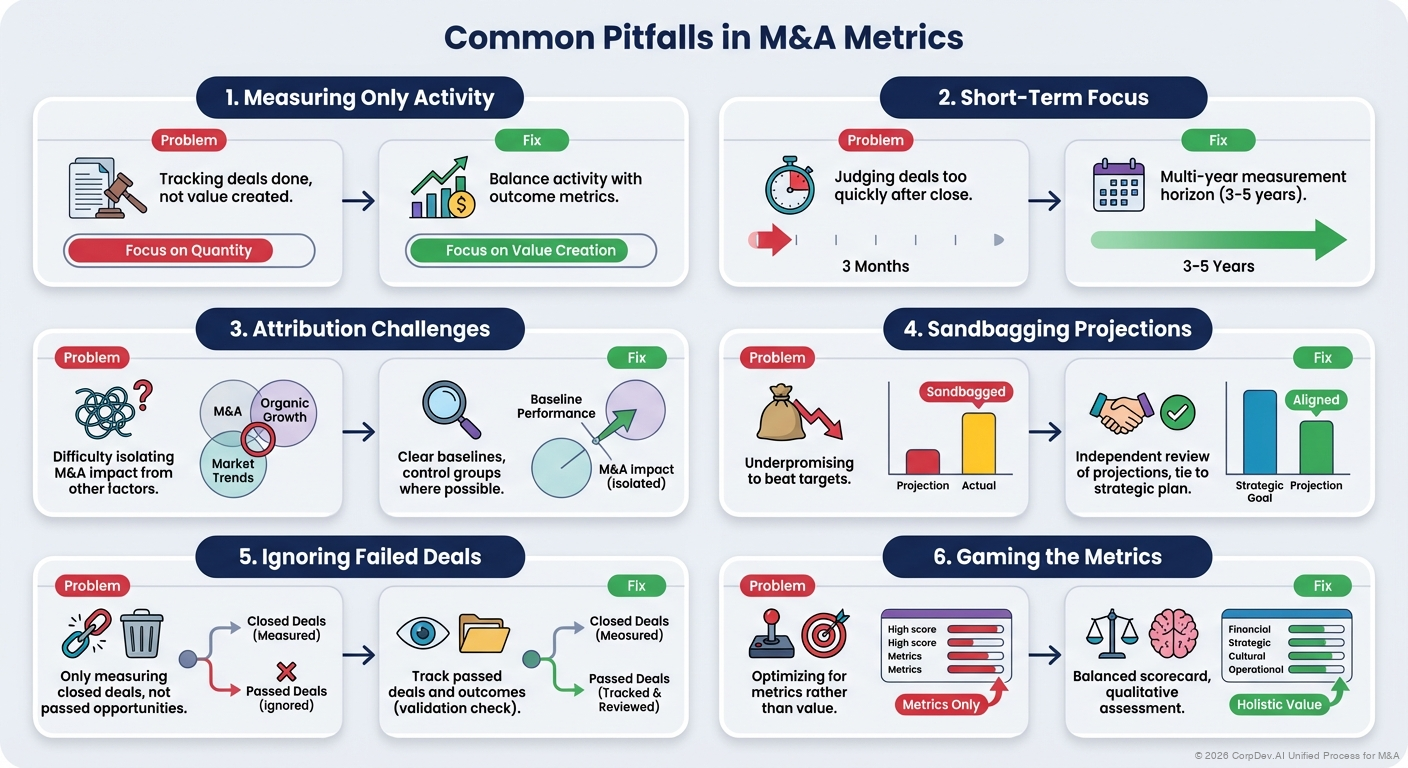
1. Measuring Only Activity
Problem: Tracking deals done, not value created
Fix: Balance activity with outcome metrics
2. Short-Term Focus
Problem: Judging deals too quickly after close
Fix: Multi-year measurement horizon (3-5 years)
3. Attribution Challenges
Problem: Difficulty isolating M&A impact from other factors
Fix: Clear baselines, control groups where possible
4. Sandbagging Projections
Problem: Underpromising to beat targets
Fix: Independent review of projections, tie to strategic plan
5. Ignoring Failed Deals
Problem: Only measuring closed deals, not passed opportunities
Fix: Track passed deals and outcomes (validation check)
6. Gaming the Metrics
Problem: Optimizing for metrics rather than value
Fix: Balanced scorecard, qualitative assessment
Sample M&A Scorecard
| Category | Metric | Target | Actual | Status |
|---|---|---|---|---|
| Activity | Companies Screened | 500 | 437 | 🟡 |
| Activity | Deals Closed | 3 | 2 | 🟡 |
| Efficiency | Time to Close | 6-9 mo | 7.5 mo | 🟢 |
| Efficiency | Cost per Deal | <5% | 4.2% | 🟢 |
| Effectiveness | Synergy Realization | >70% | 82% | 🟢 |
| Effectiveness | Revenue vs. Plan | 100% | 95% | 🟡 |
| Strategic | Strategy Alignment | >80% | 100% | 🟢 |
| Strategic | Market Share Gain | +5% | +6% | 🟢 |
Best Practices
1. Start Simple
Begin with 5-6 core metrics, expand as program matures.
2. Leading and Lagging Indicators
Balance current activity (leading) with outcomes (lagging).
3. Consistent Measurement
Use same methodology over time for trend analysis.
4. Transparent Reporting
Share metrics with stakeholders, including misses.
5. Learn from Failures
Track and analyze passed deals and failed integrations.
6. Benchmark Externally
Compare to industry peers where possible.
7. Link to Incentives
Consider tying compensation to key metrics (carefully).
8. Regular Reviews
Quarterly review of metrics, annual recalibration.
References
© 2026 CorpDev.Ai Unified Process for M&A
Last updated: Wed Jan 29 2025 19:00:00 GMT-0500 (Eastern Standard Time)