Value Creation Planning in M&A
A value creation plan is the roadmap for capturing the strategic and financial value promised in the deal thesis. It translates high-level synergy estimates into specific, actionable initiatives with owners, timelines, and KPIs.
Why Value Creation Planning Matters
The Value Realization Gap
Studies show that 50-70% of acquisitions fail to deliver expected synergies. Common reasons:
- Vague synergy estimates without detailed plans
- No ownership or accountability for synergy capture
- Integration complexity underestimated
- Lack of rigorous tracking and governance
- Unrealistic timelines
Value Creation Planning Solves This
A rigorous value creation plan:
- Transforms estimates into specific initiatives
- Assigns ownership and accountability
- Establishes realistic timelines
- Creates tracking mechanisms
- Enables course correction
Start value creation planning during due diligence, not after close. Early planning improves estimates, de-risks integration, and accelerates value capture.
Value Creation Framework
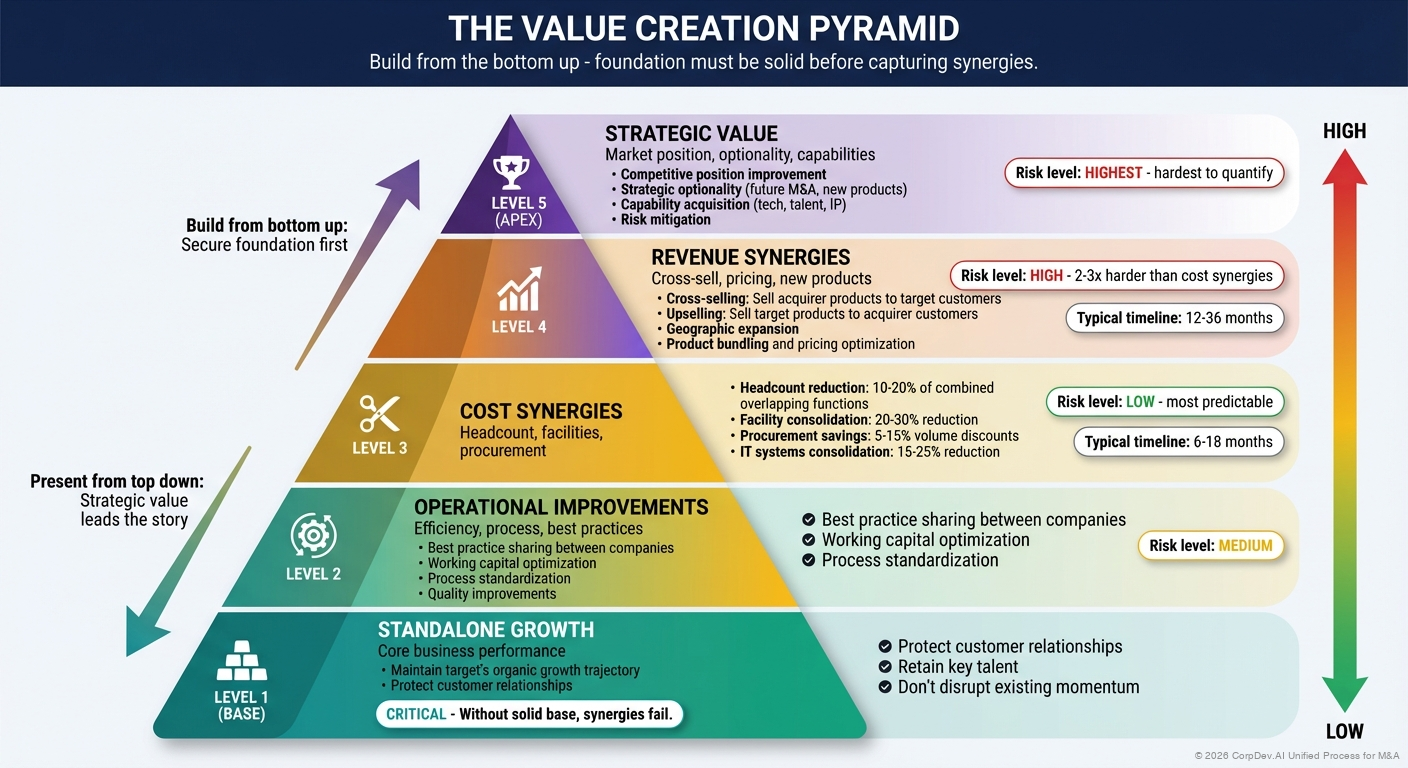
The Value Creation Pyramid
                    ┌─────────────────────┐
                    │  Strategic Value    │ ← Market position, optionality, capabilities
                    └─────────────────────┘
                    ┌─────────────────────┐
                    │  Revenue Synergies  │ ← Cross-sell, pricing, new products
                    └─────────────────────┘
                ┌───────────────────────────┐
                │     Cost Synergies        │ ← Headcount, facilities, procurement
                └───────────────────────────┘
            ┌─────────────────────────────────┐
            │    Operational Improvements     │ ← Efficiency, process, best practices
            └─────────────────────────────────┘
        ┌───────────────────────────────────────┐
        │         Standalone Growth             │ ← Core business performance
        └───────────────────────────────────────┘
Build from bottom up:
- Maintain standalone growth trajectory
- Drive operational improvements in both businesses
- Capture cost synergies (most predictable)
- Realize revenue synergies (higher risk, longer timeline)
- Achieve strategic value (competitive position, future options)
Value Creation Sources
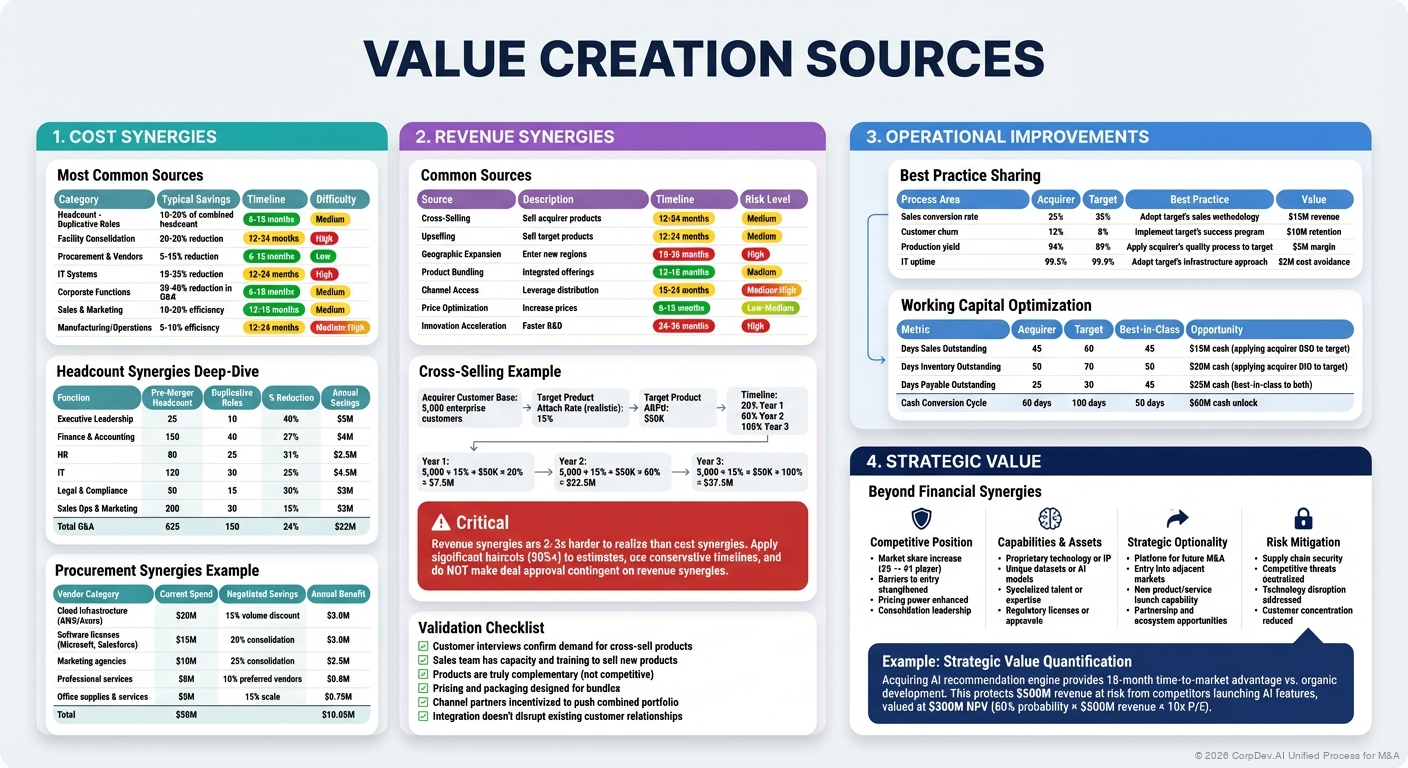
1. Cost Synergies
Most Common Sources
| Category | Typical Savings | Timeline | Difficulty |
|---|---|---|---|
| Headcount - Duplicative Roles | 10-20% of combined headcount in overlapping functions | 6-18 months | Medium |
| Facility Consolidation | 20-30% reduction in real estate costs | 12-24 months | High |
| Procurement & Vendors | 5-15% reduction through volume discounts | 6-12 months | Low |
| IT Systems | 15-25% reduction in software/infrastructure | 12-24 months | High |
| Corporate Functions | 20-40% reduction in G&A (HR, Finance, Legal) | 6-18 months | Medium |
| Sales & Marketing | 10-20% efficiency improvement | 12-18 months | Medium |
| Manufacturing/Operations | 5-10% efficiency gains | 12-24 months | Medium-High |
Headcount Synergies Deep-Dive
| Function | Pre-Merger Headcount | Duplicative Roles | % Reduction | Annual Savings |
|---|---|---|---|---|
| Executive Leadership | 25 | 10 | 40% | $5M |
| Finance & Accounting | 150 | 40 | 27% | $4M |
| HR | 80 | 25 | 31% | $2.5M |
| IT | 120 | 30 | 25% | $4.5M |
| Legal & Compliance | 50 | 15 | 30% | $3M |
| Sales Ops & Marketing | 200 | 30 | 15% | $3M |
| Total G&A | 625 | 150 | 24% | $22M |
Procurement Synergies Example
| Vendor Category | Current Spend | Negotiated Savings | Annual Benefit |
|---|---|---|---|
| Cloud infrastructure (AWS/Azure) | $20M | 15% volume discount | $3.0M |
| Software licenses (Microsoft, Salesforce) | $15M | 20% through consolidation | $3.0M |
| Marketing agencies | $10M | 25% through consolidation | $2.5M |
| Professional services | $8M | 10% through preferred vendors | $0.8M |
| Office supplies & services | $5M | 15% through scale | $0.75M |
| Total | $58M | $10.05M |
2. Revenue Synergies
Common Sources
| Source | Description | Timeline | Risk Level |
|---|---|---|---|
| Cross-Selling | Sell acquirer products to target customers | 12-24 months | Medium |
| Upselling | Sell target products to acquirer customers | 12-24 months | Medium |
| Geographic Expansion | Use target's presence to enter new regions | 18-36 months | High |
| Product Bundling | Create integrated offerings at premium pricing | 12-18 months | Medium |
| Channel Access | Leverage target's distribution for acquirer products | 18-24 months | Medium-High |
| Price Optimization | Increase prices where target was underpriced | 6-12 months | Low-Medium |
| Innovation Acceleration | Faster product development with combined R&D | 24-36 months | High |
Cross-Selling Example
Acquirer Customer Base: 5,000 enterprise customers
Target Product Attach Rate (realistic): 15% (vs. 30% optimistic)
Target Product ARPU: $50K
Timeline: 20% Year 1, 60% Year 2, 100% Year 3

Year 1: 5,000 × 15% × $50K × 20% = $7.5M
Year 2: 5,000 × 15% × $50K × 60% = $22.5M
Year 3: 5,000 × 15% × $50K × 100% = $37.5M
Revenue Synergy Risk Mitigation
Revenue synergies are 2-3x harder to realize than cost synergies. Apply significant haircuts (50%+) to estimates, use conservative timelines, and do NOT make deal approval contingent on revenue synergies.
Validation Checklist
- Customer interviews confirm demand for cross-sell products
- Sales team has capacity and training to sell new products
- Products are truly complementary (not competitive)
- Pricing and packaging designed for bundles
- Channel partners incentivized to push combined portfolio
- Integration doesn't disrupt existing customer relationships
3. Operational Improvements
Best Practice Sharing
Identify and transfer superior practices between companies:
| Process Area | Acquirer | Target | Best Practice | Value |
|---|---|---|---|---|
| Sales conversion rate | 25% | 35% | Adopt target's sales methodology | $15M revenue |
| Customer churn | 12% | 8% | Implement target's success program | $10M retention |
| Production yield | 94% | 89% | Apply acquirer's quality process to target | $5M margin |
| IT uptime | 99.5% | 99.9% | Adopt target's infrastructure approach | $2M cost avoidance |
Working Capital Optimization
| Metric | Acquirer | Target | Best-in-Class | Opportunity |
|---|---|---|---|---|
| Days Sales Outstanding | 45 | 60 | 45 | $15M cash (applying acquirer DSO to target) |
| Days Inventory Outstanding | 50 | 70 | 50 | $20M cash (applying acquirer DIO to target) |
| Days Payable Outstanding | 35 | 30 | 45 | $25M cash (best-in-class to both) |
| Cash Conversion Cycle | 60 days | 100 days | 50 days | $60M cash unlock |
4. Strategic Value
Beyond Financial Synergies
Strategic value that's harder to quantify but critical:
Competitive Position
- Market share increase (e.g., #3 → #1 player)
- Barriers to entry strengthened
- Pricing power enhanced
- Consolidation leadership
Capabilities & Assets
- Proprietary technology or IP
- Unique datasets or AI models
- Specialized talent or expertise
- Regulatory licenses or approvals
Strategic Optionality
- Platform for future M&A (buy-and-build)
- Entry into adjacent markets
- New product/service launch capability
- Partnership and ecosystem opportunities
Risk Mitigation
- Supply chain security
- Competitive threats neutralized
- Technology disruption addressed
- Customer concentration reduced
"Acquiring AI recommendation engine provides 18-month time-to-market advantage vs. organic development. This protects $500M revenue at risk from competitors launching AI features, valued at $300M NPV (60% probability × $500M revenue × 10x P/E)."
Building the Value Creation Plan
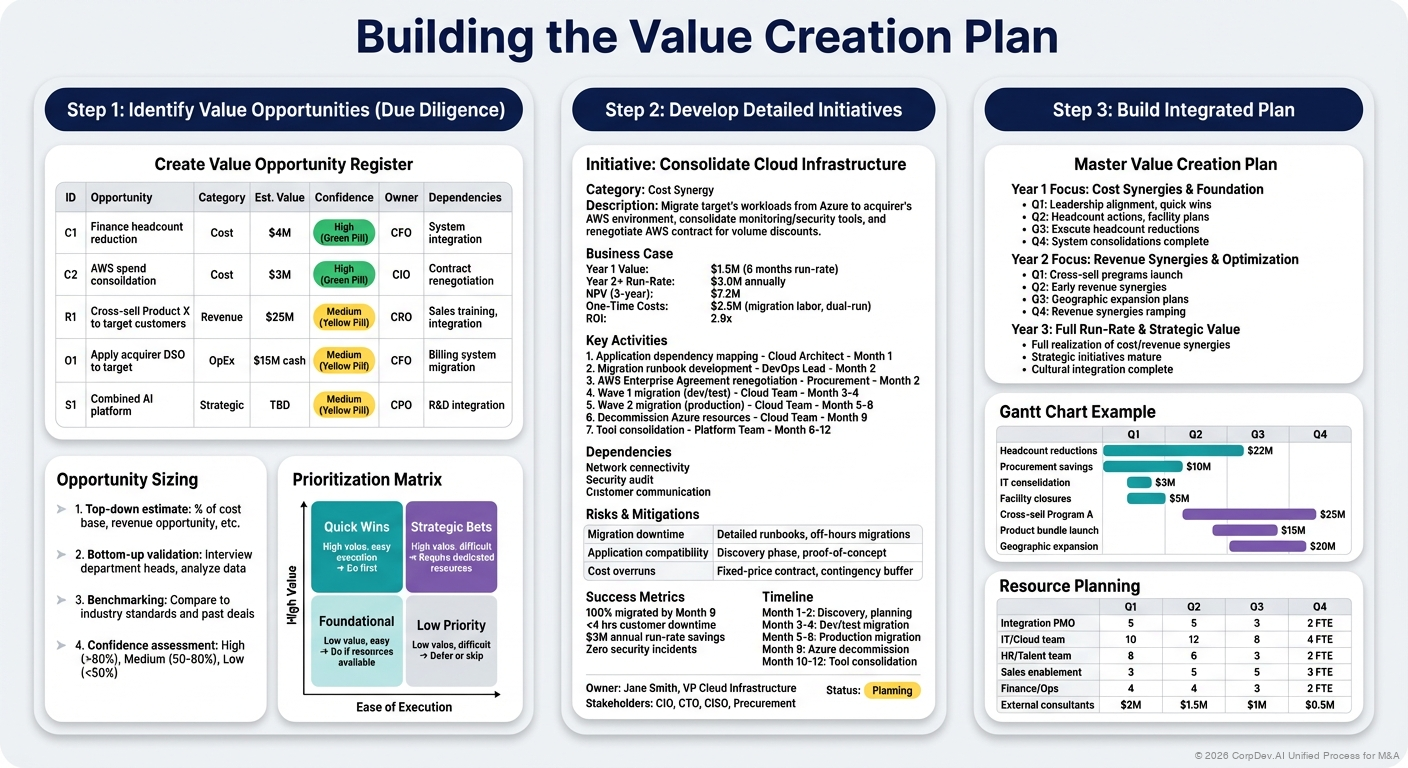
Step 1: Identify Value Opportunities (Due Diligence)
Create Value Opportunity Register
| ID | Opportunity | Category | Est. Value | Confidence | Owner | Dependencies |
|---|---|---|---|---|---|---|
| C1 | Finance headcount reduction | Cost | $4M | High | CFO | System integration |
| C2 | AWS spend consolidation | Cost | $3M | High | CIO | Contract renegotiation |
| R1 | Cross-sell Product X to target customers | Revenue | $25M | Medium | CRO | Sales training, integration |
| O1 | Apply acquirer DSO to target | OpEx | $15M cash | Medium | CFO | Billing system migration |
| S1 | Combined AI platform | Strategic | TBD | Medium | CPO | R&D integration |
Opportunity Sizing
For each opportunity:
- Top-down estimate: % of cost base, revenue opportunity, etc.
- Bottom-up validation: Interview department heads, analyze data
- Benchmarking: Compare to industry standards and past deals
- Confidence assessment: High (>80% likely), Medium (50-80%), Low (<50%)
Prioritization Matrix
                    High Value
                        │
     Quick Wins    │    Strategic Bets
                        │
    ─────────────────────────────────── Ease of Execution
                        │
     Low Priority  │    Foundational
                        │
                    Low Value
- Quick Wins: High value, easy execution → Do first (e.g., procurement savings)
- Strategic Bets: High value, difficult → Require dedicated resources (e.g., product integration)
- Foundational: Low value, easy → Do if resources available (e.g., office consolidation)
- Low Priority: Low value, difficult → Defer or skip
Step 2: Develop Detailed Initiatives
Initiative Template
## Initiative: [Name]

**Category**: Cost Synergy / Revenue Synergy / Operational / Strategic

**Description**:
[2-3 sentences describing what will be done]

**Business Case**:
- Year 1 Value: $[X]M
- Year 2 Value: $[X]M
- Year 3+ Run-Rate: $[X]M
- NPV (3-year): $[X]M
- One-Time Costs: $[X]M
- ROI: [X]x

**Key Activities**:
1. [Activity 1] - [Owner] - [Deadline]
2. [Activity 2] - [Owner] - [Deadline]
3. [Activity 3] - [Owner] - [Deadline]

**Dependencies**:
- [Dependency 1: e.g., IT systems integration]
- [Dependency 2: e.g., Leadership alignment]

**Risks & Mitigations**:
| Risk | Mitigation |
|------|------------|
| [Risk 1] | [Mitigation plan] |

**Success Metrics**:
- [KPI 1]: [Target]
- [KPI 2]: [Target]

**Timeline**:
- Month 1-3: [Milestones]
- Month 4-6: [Milestones]
- Month 7-12: [Milestones]

**Owner**: [Name, Title]
**Stakeholders**: [List]
**Status**: Not Started / Planning / In Progress / Completed
Example: IT Systems Consolidation
## Initiative: Consolidate Cloud Infrastructure

**Category**: Cost Synergy

**Description**:
Migrate target's workloads from Azure to acquirer's AWS environment, consolidate monitoring/security tools, and renegotiate AWS contract for volume discounts.

**Business Case**:
- Year 1 Value: $1.5M (6 months of run-rate savings)
- Year 2+ Run-Rate: $3.0M annually
- NPV (3-year): $7.2M
- One-Time Costs: $2.5M (migration labor, consulting, dual-run)
- ROI: 2.9x

**Key Activities**:
1. Application dependency mapping - Cloud Architect - Month 1
2. Migration runbook development - DevOps Lead - Month 2
3. AWS Enterprise Agreement renegotiation - Procurement - Month 2
4. Wave 1 migration (dev/test environments) - Cloud Team - Month 3-4
5. Wave 2 migration (production workloads) - Cloud Team - Month 5-8
6. Decommission Azure resources - Cloud Team - Month 9
7. Tool consolidation (monitoring, security) - Platform Team - Month 6-12

**Dependencies**:
- Network connectivity between acquirer/target datacenters
- Security audit and approval for data migration
- Customer communication (for any downtime)

**Risks & Mitigations**:
| Risk | Mitigation |
|------|------------|
| Migration downtime impacts customers | Detailed runbooks, extensive testing, off-hours migrations |
| Application compatibility issues | Discovery phase, proof-of-concept migrations, fallback plan |
| Cost overruns on migration labor | Fixed-price consulting contract, contingency buffer |

**Success Metrics**:
- 100% of workloads migrated by Month 9
- <4 hours total customer-facing downtime
- $3M annual run-rate savings achieved
- Zero security incidents during migration

**Timeline**:
- Month 1-2: Discovery, planning, contract negotiation
- Month 3-4: Dev/test migration, validation
- Month 5-8: Production migration (phased)
- Month 9: Azure decommission
- Month 10-12: Tool consolidation, optimization

**Owner**: Jane Smith, VP Cloud Infrastructure
**Stakeholders**: CIO, CTO, CISO, Procurement, Customer Success
**Status**: Planning
Step 3: Build Integrated Plan
Master Value Creation Plan
Consolidate all initiatives into integrated roadmap:
Year 1 Focus: Cost Synergies & Foundation
- Q1: Leadership alignment, quick wins (procurement, redundant systems)
- Q2: Headcount actions, facility plans, IT migration start
- Q3: Execute headcount reductions, migrate facilities
- Q4: System consolidations complete, year-end cost savings realized
Year 2 Focus: Revenue Synergies & Optimization
- Q1: Cross-sell programs launch, product training complete
- Q2: Early revenue synergies, best practice sharing
- Q3: Geographic expansion plans, new product bundles
- Q4: Revenue synergies ramping, operations optimization
Year 3: Full Run-Rate & Strategic Value
- Full realization of cost and revenue synergies
- Strategic initiatives mature (new products, market expansion)
- Cultural integration complete, "one company" operating model
Gantt Chart Example
| Initiative | Q1 | Q2 | Q3 | Q4 | Y2 | Y3 | Value |
|---|---|---|---|---|---|---|---|
| Headcount reductions | ███████ | $22M | |||||
| Procurement savings | █████ | ████ | $10M | ||||
| IT consolidation | ████ | ████ | ████ | $3M | |||
| Facility closures | ██ | ████ | ████ | ██ | $5M | ||
| Cross-sell Program A | ███ | ████ | ████ | ████ | $25M | ||
| Product bundle launch | ████ | ████ | ████ | $15M | |||
| Geographic expansion | ███ | ████ | ████ | $20M |
Resource Planning
| Resource | Q1 | Q2 | Q3 | Q4 |
|---|---|---|---|---|
| Integration PMO | 5 FTE | 5 FTE | 3 FTE | 2 FTE |
| IT/Cloud team | 10 FTE | 12 FTE | 8 FTE | 4 FTE |
| HR/Talent team | 8 FTE | 6 FTE | 3 FTE | 2 FTE |
| Sales enablement | 3 FTE | 5 FTE | 5 FTE | 3 FTE |
| Finance/Ops | 4 FTE | 4 FTE | 3 FTE | 2 FTE |
| External consultants | $2M | $1.5M | $1M | $0.5M |
Step 4: Establish Governance
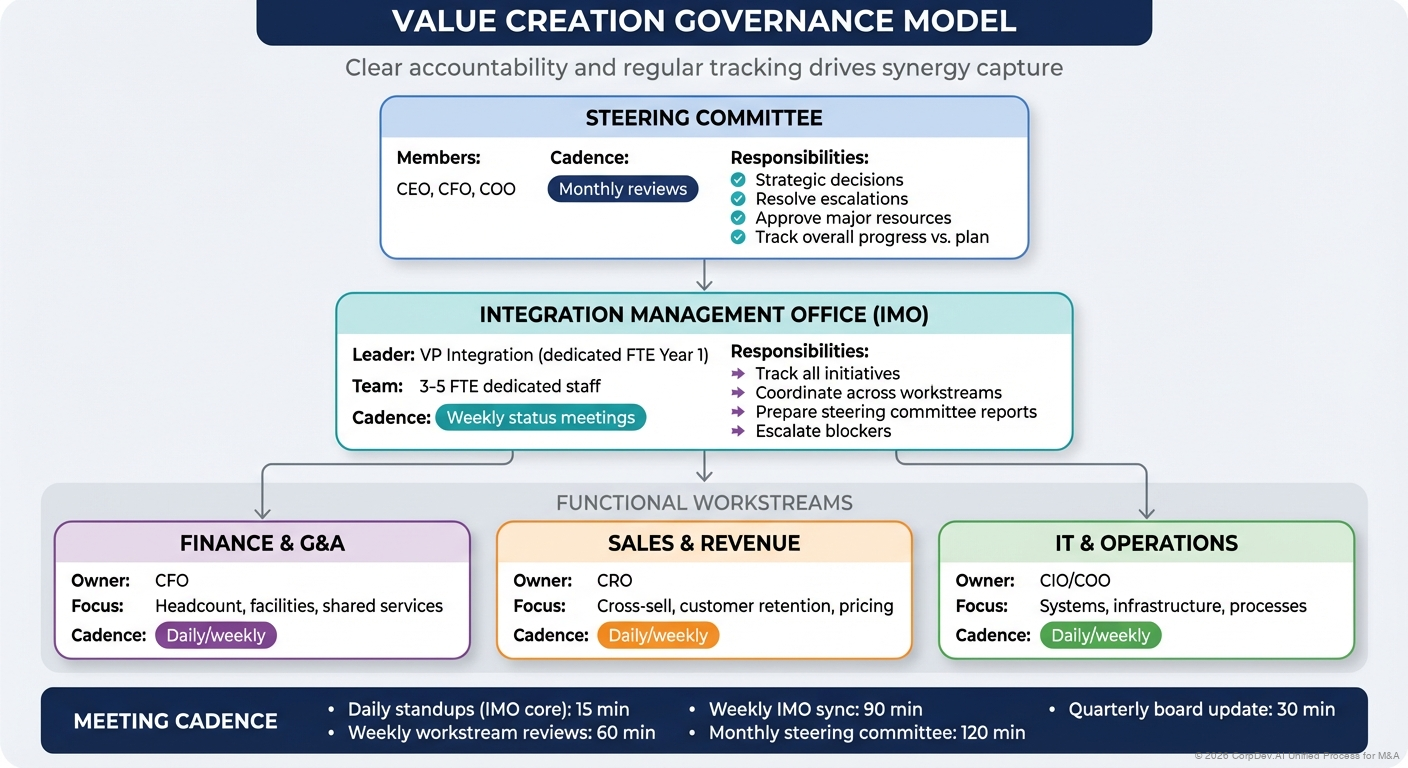
Value Creation Governance Model
┌─────────────────────────────────────┐
│     Steering Committee              │ ← CEO, CFO, COO (monthly)
│  - Resolve escalations               │
│  - Approve major decisions           │
└─────────────────────────────────────┘
              │
┌─────────────────────────────────────┐
│   Integration Management Office     │ ← VP Integration (weekly)
│  - Track all initiatives             │
│  - Report to steering committee      │
└─────────────────────────────────────┘
              │
┌──────────────┬──────────────┬─────────────┐
│ Workstream 1 │ Workstream 2 │ Workstream 3│ ← Functional leads (daily/weekly)
│ (Finance)    │ (Sales)      │ (IT)        │
└──────────────┴──────────────┴─────────────┘
Roles & Responsibilities
| Role | Responsibilities | Time Commitment |
|---|---|---|
| Steering Committee | Strategic decisions, escalation resolution, resource allocation | 4-8 hours/month |
| Integration Lead (VP/SVP) | Overall accountability, cross-functional coordination, reporting | 100% dedicated Y1 |
| IMO Team | Tracking, reporting, documentation, meeting facilitation | 3-5 FTE dedicated |
| Workstream Leads | Initiative execution, functional alignment, milestone delivery | 50-100% depending on phase |
| Initiative Owners | Detailed planning, day-to-day execution, status updates | 25-50% |
Meeting Cadence
- Daily standups (IMO core team): 15 min, blockers and priorities
- Weekly workstream reviews: 60 min, detailed status, issue resolution
- Weekly IMO sync: 90 min, cross-functional dependencies, reporting
- Monthly steering committee: 120 min, dashboard review, decisions, escalations
- Quarterly board update: 30 min, progress vs. plan, financial impact
Step 5: Track and Report
Value Creation Dashboard
| Category | Target (Y1) | Actual (YTD) | % Achieved | Forecast (EOY) | Status |
|---|---|---|---|---|---|
| Cost Synergies | $40M | $28M | 70% | $42M | 🟢 On Track |
| - Headcount | $22M | $18M | 82% | $23M | 🟢 |
| - Procurement | $10M | $7M | 70% | $11M | 🟢 |
| - IT | $3M | $1.5M | 50% | $3M | 🟡 At Risk |
| - Facilities | $5M | $1.5M | 30% | $5M | 🟡 At Risk |
| Revenue Synergies | $10M | $3M | 30% | $8M | 🟡 At Risk |
| - Cross-sell | $8M | $2.5M | 31% | $7M | 🟡 |
| - Upsell | $2M | $0.5M | 25% | $1M | 🔴 Behind |
| Total Value Created | $50M | $31M | 62% | $50M | 🟢 |
KPI Scorecard
| KPI | Baseline | Target | Current | Trend |
|---|---|---|---|---|
| Combined revenue growth | 15% | 20% | 18% | ↗ |
| EBITDA margin | 20% | 25% | 23% | ↗ |
| Customer retention | 88% | 92% | 90% | ↗ |
| Employee attrition | 18% | <15% | 16% | ↘ |
| NPS (combined) | 45 | 55 | 52 | ↗ |
| Integration costs | $50M budget | <$50M | $42M | 🟢 |
Status Colors
- 🟢 On Track: ≥90% of target
- 🟡 At Risk: 70-89% of target, mitigation plan in place
- 🔴 Behind: <70% of target, escalation required
Monthly Report Template
## Integration Status Report - [Month Year]

### Executive Summary
[2-3 sentences: overall status, key wins, critical issues]

### Financial Summary
- Total Value Realized YTD: $[X]M ([X]% of annual target)
- Forecast EOY: $[X]M ([X]% of annual target)
- Integration Costs YTD: $[X]M ([X]% of budget)

### Key Achievements This Month
1. [Achievement 1 with impact]
2. [Achievement 2 with impact]
3. [Achievement 3 with impact]

### Critical Issues
| Issue | Impact | Owner | Mitigation | ETA |
|-------|--------|-------|------------|-----|
| [Issue 1] | [Financial/operational impact] | [Name] | [Action plan] | [Date] |

### Initiative Status (Top 10 by Value)
[Table showing initiative, owner, status, value realized, forecast]

### Upcoming Milestones (Next 30 Days)
- [Milestone 1] - [Date]
- [Milestone 2] - [Date]

### Requests for Steering Committee
1. [Decision needed or resource request]
Value Capture Playbooks
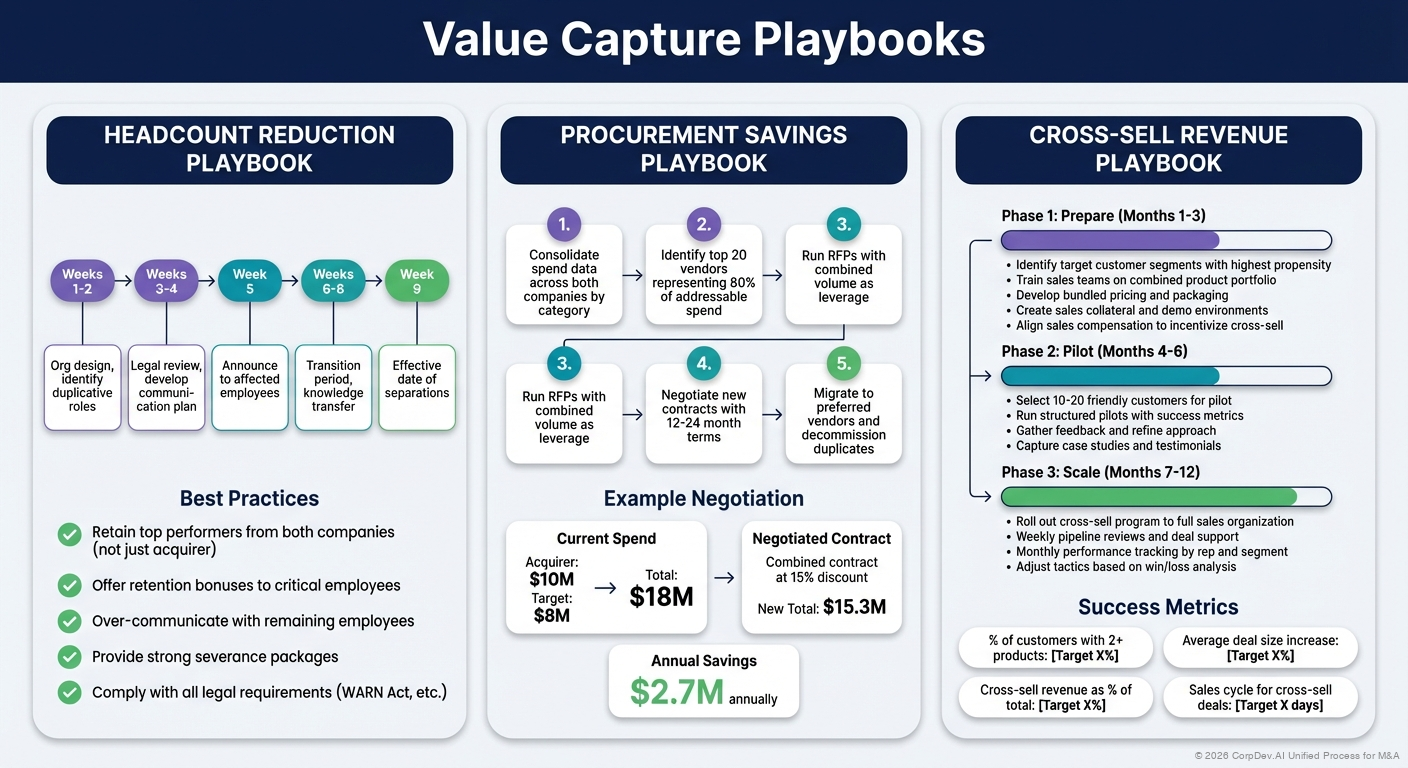
Headcount Reduction Playbook
Timeline
- Weeks 1-2: Org design, identify duplicative roles
- Weeks 3-4: Legal review, develop communication plan
- Week 5: Announce to affected employees
- Weeks 6-8: Transition period, knowledge transfer
- Week 9: Effective date of separations
Best Practices
- Retain top performers from both companies (not just acquirer)
- Offer retention bonuses to critical employees
- Over-communicate with remaining employees
- Provide strong severance packages
- Comply with all legal requirements (WARN Act, etc.)
Procurement Savings Playbook
Approach
- Consolidate spend data across both companies by category
- Identify top 20 vendors representing 80% of addressable spend
- Run RFPs with combined volume as leverage
- Negotiate new contracts with 12-24 month terms
- Migrate to preferred vendors and decommission duplicates
Example Negotiation
- Current: Acquirer pays $10M, Target pays $8M = $18M total
- Negotiated: Combined contract at 15% discount = $15.3M
- Savings: $2.7M annually
Cross-Sell Revenue Playbook
Phase 1: Prepare (Months 1-3)
- Identify target customer segments with highest propensity
- Train sales teams on combined product portfolio
- Develop bundled pricing and packaging
- Create sales collateral and demo environments
- Align sales compensation to incentivize cross-sell
Phase 2: Pilot (Months 4-6)
- Select 10-20 friendly customers for pilot
- Run structured pilots with success metrics
- Gather feedback and refine approach
- Capture case studies and testimonials
Phase 3: Scale (Months 7-12)
- Roll out cross-sell program to full sales organization
- Weekly pipeline reviews and deal support
- Monthly performance tracking by rep and segment
- Adjust tactics based on win/loss analysis
Success Metrics
- % of customers with 2+ products: [Target X%]
- Average deal size increase: [Target X%]
- Cross-sell revenue as % of total: [Target X%]
- Sales cycle for cross-sell deals: [Target X days]
Common Pitfalls & How to Avoid
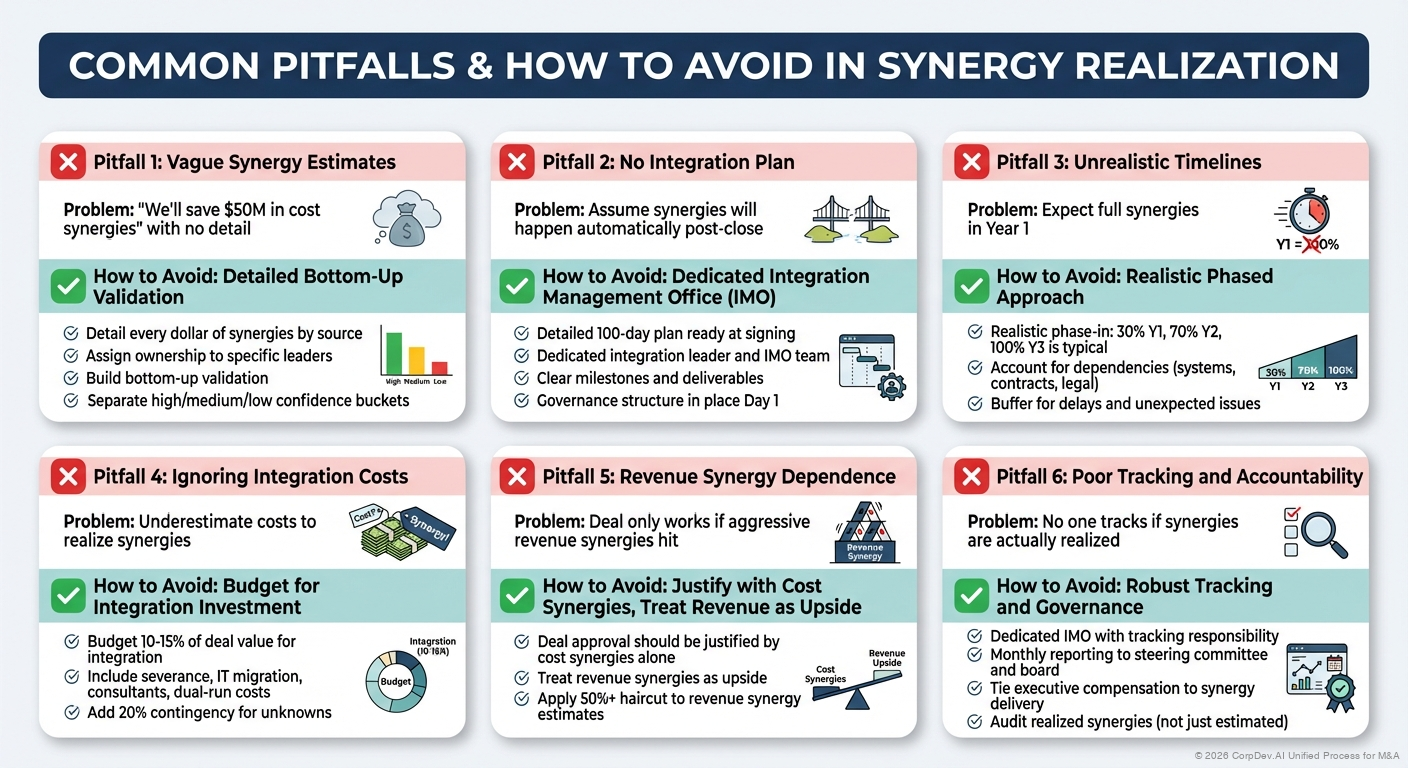
❌ Pitfall 1: Vague Synergy Estimates
Problem: "We'll save $50M in cost synergies" with no detail
Solution:
- Detail every dollar of synergies by source
- Assign ownership to specific leaders
- Build bottom-up validation
- Separate high/medium/low confidence buckets
❌ Pitfall 2: No Integration Plan
Problem: Assume synergies will happen automatically post-close
Solution:
- Detailed 100-day plan ready at signing
- Dedicated integration leader and IMO team
- Clear milestones and deliverables
- Governance structure in place Day 1
❌ Pitfall 3: Unrealistic Timelines
Problem: Expect full synergies in Year 1
Solution:
- Realistic phase-in: 30% Y1, 70% Y2, 100% Y3 is typical
- Account for dependencies (systems, contracts, legal)
- Buffer for delays and unexpected issues
❌ Pitfall 4: Ignoring Integration Costs
Problem: Underestimate costs to realize synergies
Solution:
- Budget 10-15% of deal value for integration
- Include severance, IT migration, consultants, dual-run costs
- Add 20% contingency for unknowns
❌ Pitfall 5: Revenue Synergy Dependence
Problem: Deal only works if aggressive revenue synergies hit
Solution:
- Deal approval should be justified by cost synergies alone
- Treat revenue synergies as upside
- Apply 50%+ haircut to revenue synergy estimates
❌ Pitfall 6: Poor Tracking and Accountability
Problem: No one tracks if synergies are actually realized
Solution:
- Dedicated IMO with tracking responsibility
- Monthly reporting to steering committee and board
- Tie executive compensation to synergy delivery
- Audit realized synergies (not just estimated)
Value Creation Checklist
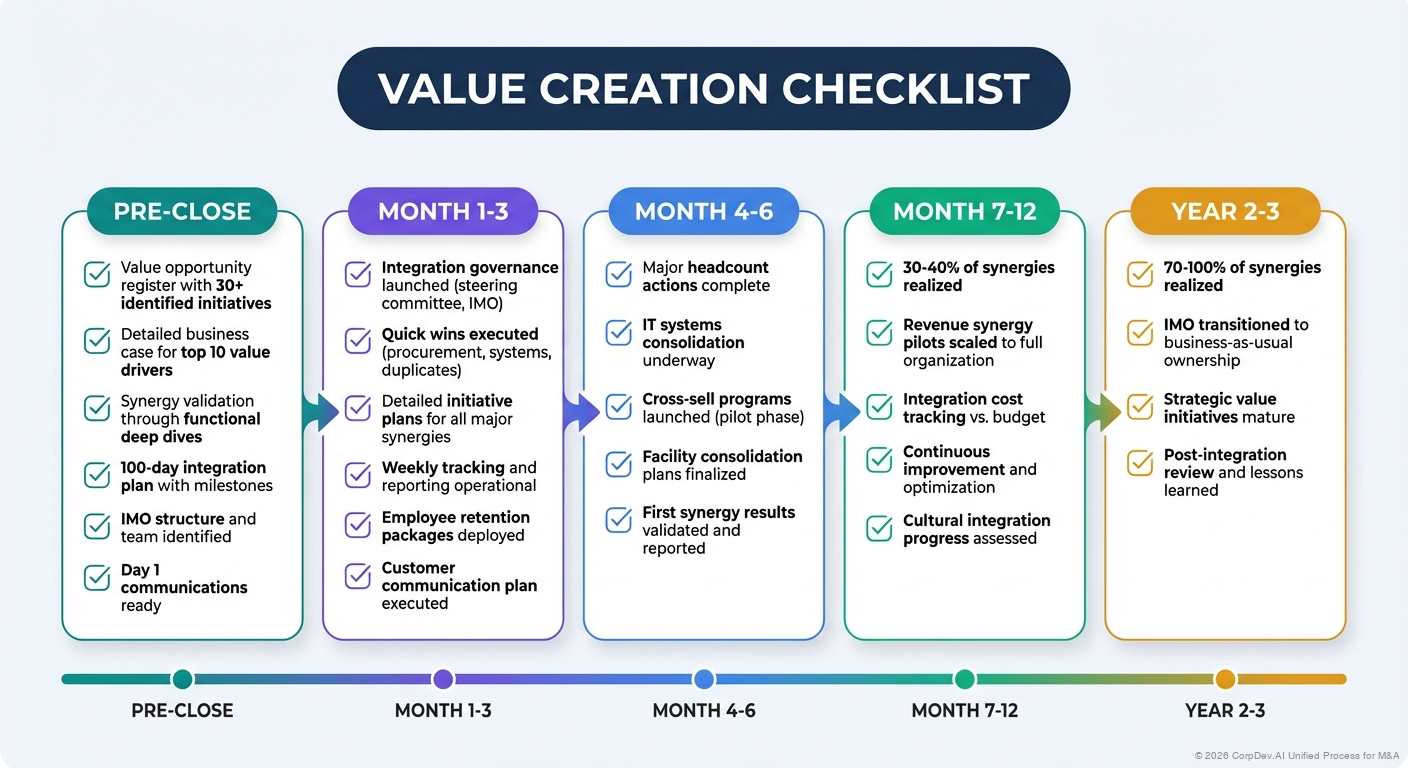
Pre-Close
- Value opportunity register with 30+ identified initiatives
- Detailed business case for top 10 value drivers
- Synergy validation through functional deep dives
- 100-day integration plan with milestones
- IMO structure and team identified
- Day 1 communications ready
Month 1-3
- Integration governance launched (steering committee, IMO)
- Quick wins executed (procurement, systems, duplicates)
- Detailed initiative plans for all major synergies
- Weekly tracking and reporting operational
- Employee retention packages deployed
- Customer communication plan executed
Month 4-6
- Major headcount actions complete
- IT systems consolidation underway
- Cross-sell programs launched (pilot phase)
- Facility consolidation plans finalized
- First synergy results validated and reported
Month 7-12
- 30-40% of synergies realized
- Revenue synergy pilots scaled to full organization
- Integration cost tracking vs. budget
- Continuous improvement and optimization
- Cultural integration progress assessed
Year 2-3
- 70-100% of synergies realized
- IMO transitioned to business-as-usual ownership
- Strategic value initiatives mature
- Post-integration review and lessons learned
Case Study: Value Creation in Action
TechCo acquires CloudSecure ($500M deal)
Promised Synergies (Deal Approval)
- Cost Synergies: $120M NPV (headcount, procurement, IT)
- Revenue Synergies: $30M NPV (conservative cross-sell only)
- Total: $150M value creation
Value Creation Plan (Top Initiatives)
Headcount Reduction ($50M run-rate)
- Owner: CHRO
- Timeline: Announce Month 2, effective Month 4
- Execution: 250 roles eliminated (20% of combined G&A)
- Status: ✓ Completed on time, $52M actual savings
AWS Contract Renegotiation ($8M run-rate)
- Owner: CIO
- Timeline: Month 2-3 negotiation, Month 4 new contract
- Execution: Combined $30M spend → 25% discount
- Status: ✓ Exceeded target, $9.5M savings
Office Consolidation ($12M run-rate)
- Owner: CFO
- Timeline: Month 6 lease termination, Month 9 move
- Execution: Close 3 of 5 CloudSecure offices, co-locate teams
- Status: 🟡 Delayed 3 months (real estate negotiations), $12M savings achieved Month 12
Cross-Sell Security to TechCo customers ($40M revenue Y2)
- Owner: CRO
- Timeline: Month 4 pilot, Month 7 scale
- Execution: Train 500 AEs, bundle pricing, joint demos
- Status: 🟢 $35M revenue by EOY2 (88% of target)
Product Integration (Strategic value)
- Owner: CPO
- Timeline: Month 6 roadmap, Month 12 beta, Month 18 GA
- Execution: Unified security platform (AI-powered)
- Status: 🟢 On track, beta launched Month 11
Results After 2 Years
- Cost Synergies Realized: $130M (108% of target) 🟢
- Revenue Synergies Realized: $35M (117% of conservative target) 🟢
- Integration Costs: $68M (vs. $75M budget) 🟢
- Total Value Created: $165M NPV (110% of promise) ✅
Key Success Factors
- Detailed planning during due diligence (synergy validation)
- Strong IMO with dedicated VP and 5-person team
- Conservative revenue synergy assumptions
- Executive compensation tied to synergy delivery
- Monthly board reporting maintained discipline
Key Takeaways
- Value creation planning turns promises into reality - detailed initiatives with owners and timelines
- Start planning during due diligence - don't wait until close
- Cost synergies are most predictable - should justify the deal alone
- Revenue synergies are risky - use conservative assumptions, treat as upside
- Integration costs are real - budget 10-15% of deal value
- Governance and tracking matter - IMO, steering committee, monthly reporting
- Realistic timelines - 30% Y1, 70% Y2, 100% Y3 is normal cadence
- Validate and adjust - track actual vs. plan, course correct quickly
The value creation plan is where the deal thesis meets reality. Acquisitions succeed or fail based on execution, not just strategy. Rigorous planning, disciplined tracking, and strong governance are what separate value-creating deals from disappointments.
Related Resources
- Deal Thesis Overview - Building comprehensive deal thesis
- Strategic Rationale - Articulating strategic logic
- Business Case Development - Financial justification and ROI
- Post-Merger Integration - Integration execution best practices
- M&A Process Overview - End-to-end M&A process
© 2026 CorpDev.Ai Unified Process for M&A
Last updated: Thu Oct 30 2025 20:00:00 GMT-0400 (Eastern Daylight Time)