Comparable Company Analysis
Comparable Company Analysis ("Comps" or "Trading Comps") is a relative valuation method that values a company based on how similar publicly-traded companies are valued by the market. This guide covers how to select, analyze, and apply comparable company multiples in M&A.

What is Comparable Company Analysis?
Definition: Valuation methodology that compares the target company's financial metrics and valuation multiples to similar publicly-traded companies.
Core Principle: Similar companies should trade at similar multiples. If Company A and Company B have similar growth, margins, and risk profiles, they should have similar EV/EBITDA multiples.
When to Use:
- Quick market-based valuation
- Triangulate with DCF analysis
- Understand market perception
- Set initial valuation expectations
- Price negotiation and justification
Advantages:
- Based on real market data
- Relatively quick to perform
- Easy to understand and explain
- Market reality check
Limitations:
- No two companies are truly identical
- Private company adjustments needed
- Market may be under/overvaluing sector
- Can be manipulated through comp selection
Step-by-Step Comps Process
Step 1: Select Comparable Companies
Selection Criteria:
Industry/Sector (Most Important):
- Same primary business
- Similar products/services
- Same end markets
- Comparable business model
Size:
- Revenue within 0.5x - 2x of target
- For small targets, use larger comps (will trade at discount)
- Market cap considerations
Geography:
- Similar geographic footprint
- Same regulatory environment
- Comparable market dynamics
Growth Profile:
- Similar growth rates (±5-10%)
- Comparable maturity stage
- Similar expansion trajectory
Profitability:
- Similar margin structure
- Comparable unit economics
- Similar capital intensity
Other Factors:
- Public float / liquidity
- Capital structure
- Customer concentration
- Technology platform
Ideal Comp Universe: 5-15 companies
Example - SaaS Company Target:
Target Profile:
- $50M ARR, growing 40%
- Vertical SaaS for healthcare
- 75% gross margin, -10% EBITDA margin (investing in growth)
- SMB and Mid-market focus
Selected Comps:
- Veeva Systems (Healthcare vertical SaaS, $2B revenue)
- Phreesia ($250M revenue, similar profile)
- HealthStream ($250M revenue, healthcare learning)
- Certara ($350M revenue, healthcare software)
- Omnicell ($1B revenue, healthcare automation)
- Similar private market acquisitions
Step 2: Gather Financial Data
Required Data Points:
Market Data:
- Current stock price
- Shares outstanding (fully diluted)
- Market capitalization
- Net debt (debt - cash)
- Enterprise value
Income Statement:
- Revenue (current year, NTM, LTM)
- Gross profit and margin
- EBITDA and margin
- EBIT and margin
- Net income
- EPS
Balance Sheet:
- Total debt
- Cash and equivalents
- Book value of equity
Growth Metrics:
- Historical revenue growth (1yr, 3yr, 5yr)
- Projected revenue growth (NTM)
- EBITDA growth
Data Sources:
- Capital IQ, FactSet, Bloomberg (institutional)
- Company filings (10-K, 10-Q)
- Earnings presentations
- Consensus analyst estimates (for NTM)
- PitchBook, Crunchbase (private comps)
Step 3: Calculate Valuation Multiples
Enterprise Value Multiples:
EV / Revenue:
Enterprise Value / LTM Revenue
Enterprise Value / NTM Revenue
Use Cases:
- High-growth companies
- Pre-profitable companies
- SaaS and software
- Quickly screening companies
EV / EBITDA:
Enterprise Value / LTM EBITDA
Enterprise Value / NTM EBITDA
Use Cases:
- Mature, profitable companies
- Most common multiple in M&A
- Manufacturing, services, traditional sectors
- Comparing companies with different capital structures
EV / EBIT:
Enterprise Value / LTM EBIT
Use Cases:
- When D&A differs significantly
- Mature companies
- Less common than EV/EBITDA
Equity Value Multiples:
P/E Ratio:
Price per Share / Earnings per Share
Market Cap / Net Income
Use Cases:
- Comparing public companies
- Less relevant for M&A (focus on EV multiples)
Price / Book:
Market Cap / Book Value of Equity
Use Cases:
- Financial services (banks, insurance)
- Asset-heavy businesses
- Distressed situations
Industry-Specific Multiples:
SaaS / Software:
- EV / ARR (Annual Recurring Revenue)
- EV / Bookings
- Revenue per employee
Subscription Businesses:
- EV / Subscribers
- EV / MRR (Monthly Recurring Revenue)
E-commerce / Marketplaces:
- EV / GMV (Gross Merchandise Value)
- Take rate (% of GMV)
Media / Advertising:
- EV / Impressions
- EV / Users
- ARPU (Average Revenue Per User)
Healthcare / Biotech:
- EV / Addressable patients
- Pipeline value
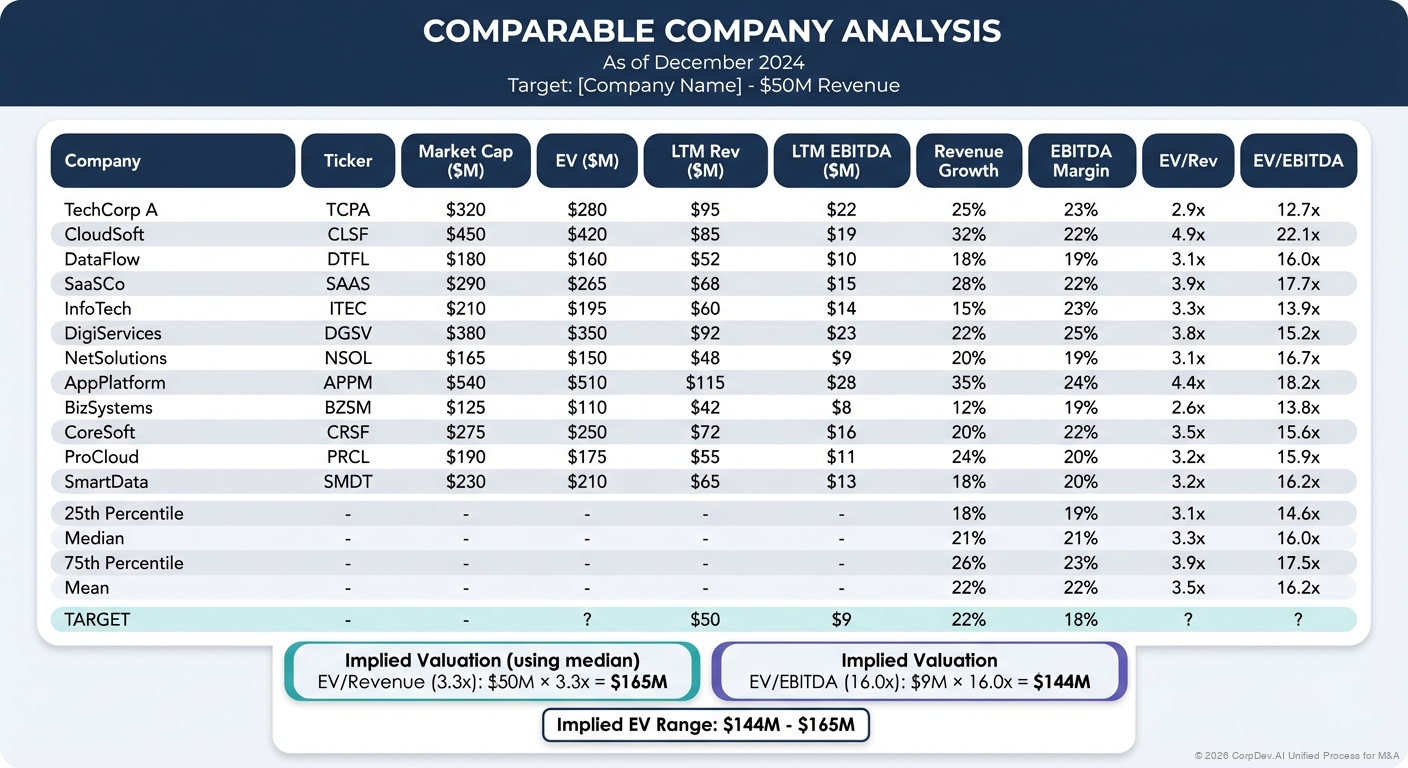
Step 4: Build Comparable Company Table
Example Comps Table (Simplified):
                                    Market                                    EV /        EV /       Revenue  EBITDA
Company              Ticker    Cap ($M)  EV ($M)  Rev ($M)  EBITDA ($M)    Revenue     EBITDA      Growth   Margin
─────────────────────────────────────────────────────────────────────────────────────────────────────────────────────
Veeva Systems        VEEV      $35,200   $34,100   $2,200    $770          15.5x       44.3x       18%      35%
Phreesia             PHR       $1,800    $1,700    $250      $5            6.8x        340.0x      30%      2%
HealthStream         HSTM      $850      $800      $250      $50           3.2x        16.0x       5%       20%
Certara              CERT      $3,200    $3,500    $350      $105          10.0x       33.3x       25%      30%
Omnicell             OMCL      $4,500    $4,800    $1,200    $180          4.0x        26.7x       10%      15%

Mean                                                                         7.9x        92.1x       18%      20%
Median                                                                       6.8x        33.3x       18%      20%
────────────────────────────────────────────────────────────────────────────────────────────────────────────────────

Target Company                         $50       $5                         ?           ?           40%      -10%
Step 5: Normalize and Adjust Multiples
Adjustments to Consider:
Size Discount/Premium:
- Smaller companies trade at discount (10-30%)
- Liquidity and coverage impact multiples
- Consider applying 15-25% small-cap discount
Growth Adjustment:
- Higher growth deserves higher multiples
- Normalize for growth differences
- Common: Divide EV/Revenue by growth rate = PEG-style ratio
Profitability Adjustment:
- More profitable companies trade higher
- Adjust for EBITDA margin differences
- Rule of thumb: 0.5x EV/Revenue per 10% EBITDA margin
Private Company Discount:
- Private companies lack liquidity
- Typical discount: 20-30% vs. public comps
- Varies by situation and buyer
Control Premium:
- M&A transactions include control premium
- Typical: 20-35% above trading price
- Offsets some of the private discount
Example Adjustment:
Target: 40% growth, -10% EBITDA margin
Comps median: 18% growth, 20% EBITDA margin

Median EV/Revenue: 6.8x

Growth adjustment: +2.0x (22% higher growth)
Profitability adjustment: -1.5x (30% lower margins)
Adjusted multiple: 7.3x

Private company discount (20%): -1.5x
Control premium (25%): +1.4x
Net adjustment: -0.1x

Implied EV/Revenue: 7.2x
Step 6: Apply Multiples to Target
Method 1: Apply Range of Multiples
Target LTM Revenue: $50M

                    Low     Median  High
EV/Revenue Multiple 6.0x    7.2x    8.5x

Implied EV          $300M   $360M   $425M
Method 2: Apply Multiple to Projected Financials
Target NTM Revenue: $70M (40% growth)
EV/Revenue Multiple: 7.2x
Implied EV: $504M

Target NTM EBITDA: $7M (10% margin)
EV/EBITDA Multiple: 35x
Implied EV: $245M

Range: $245M - $504M
Midpoint: $375M
Step 7: Calculate Equity Value
Enterprise Value:              $360M
+ Cash:                        $5M
- Debt:                        ($10M)
- Minority Interest:           $0M
- Preferred Stock:             $0M
= Equity Value:                $355M
Selecting the Right Multiple
By Company Stage:
Pre-Revenue / Early Stage:
- Can't use revenue or EBITDA multiples
- Use industry benchmarks
- Consider cost to replicate
- Precedent transaction analysis more useful
High Growth, Pre-Profitable (most tech):
- EV / Revenue primary metric
- Adjust for growth rate (Rule of 40)
- Consider path to profitability
- LTV/CAC ratio if available
Profitable Growth:
- EV / Revenue and EV / EBITDA
- Weight both multiples
- Consider both current and forward multiples
Mature / Stable:
- EV / EBITDA primary metric
- EV / EBIT if appropriate
- Focus on cash generation
- Consider FCF multiples
By Industry:
SaaS / Software:
- Primary: EV / ARR
- Secondary: EV / Revenue, growth-adjusted
- Rule of 40 (Growth + FCF Margin)
- CAC payback period
Manufacturing / Industrial:
- Primary: EV / EBITDA
- Consider capacity utilization
- Cyclical adjustments
Financial Services:
- P/E and Price/Book
- ROE considerations
- Regulatory capital requirements
Healthcare Services:
- EV / EBITDA
- Per-location or per-patient metrics
- Reimbursement environment
E-commerce / Marketplaces:
- EV / GMV
- Take rate
- Unit economics
The "Rule of 40" for SaaS
Formula:
Rule of 40 = Revenue Growth % + FCF Margin %
Interpretation:
40: Excellent, deserves premium multiple
- 30-40: Good performance
- <30: Needs improvement
Example:
Company A: 50% growth + (-10)% FCF margin = 40 ✓
Company B: 20% growth + 25% FCF margin = 45 ✓✓
Company C: 15% growth + 5% FCF margin = 20 ✗
Impact on Valuation:
Rule of 40 Score    Typical EV/Revenue Multiple
50+                 15-25x
40-50               10-15x
30-40               6-10x
20-30               3-6x
<20                 1-3x
Creating a Football Field Valuation
Visualize Range of Values:
Valuation Methodology          Low         Mid         High
═══════════════════════════════════════════════════════════
DCF Analysis                   $300M ████████████████ $400M
Trading Comps                  $320M ████████████████████ $440M
Precedent Transactions         $350M ████████████████████████ $480M

Implied Valuation Range:       $320M ████████████████████ $440M
                                     Target: $380M
Common Comparable Company Pitfalls
1. Cherry-Picking Comps
Problem: Selecting only high-multiple comparables
Solution:
- Use objective selection criteria
- Include all reasonable comps
- Show eliminated companies and rationale
- Consider both high and low multiples
2. Ignoring Differences
Problem: Treating all comps as equivalent
Solution:
- Analyze why multiples differ
- Adjust for growth, margins, size
- Weight more similar comps higher
- Explain differences to stakeholders
3. Over-Relying on Outliers
Problem: Using extreme high or low multiples
Solution:
- Use median, not mean
- Consider removing true outliers
- Understand why outliers exist
- Weight toward similar companies
4. Wrong Time Period
Problem: Using mismatched time periods
Solution:
- Consistent LTM vs. NTM across all comps
- Update for latest financials
- Consider forward-looking multiples
- Adjust for seasonality
5. Not Adjusting for Size
Problem: Comparing $50M company to $5B company
Solution:
- Apply size discount (15-30%)
- Focus on closer size comps
- Understand liquidity premium
- Consider scaling factors
6. Ignoring Market Conditions
Problem: Using comps during market extremes
Solution:
- Understand if sector is over/under-valued
- Look at historical trading ranges
- Consider normalizing multiples
- Use multiple timeframes if volatile
7. Capital Structure Confusion
Problem: Mixing EV and equity multiples
Solution:
- Use EV multiples for M&A (EV/Revenue, EV/EBITDA)
- Equity multiples (P/E) less relevant
- Understand leverage impact
- Normalize capital structure if needed
Best Practices
1. Cast a Wide Net Initially
Start with 20-30 potential comps, narrow to 8-12 best
2. Be Transparent
Show all comps, explain exclusions, document rationale
3. Multiple Metrics
Don't rely on single multiple - use 2-3 relevant metrics
4. Sanity Check
Does the implied valuation make sense?
- As % of revenue
- Per employee
- Per customer
- vs. historical transactions
5. Triangulate
Combine with DCF and precedent transactions
6. Update Regularly
Market multiples change - refresh for presentations
7. Understand the Story
Why do certain comps trade at premium/discount?
What drives valuation in this sector?
Advanced Topics
Regression Analysis
Statistical approach to adjusting for differences:
- Dependent variable: EV/Revenue
- Independent variables: Growth rate, EBITDA margin, size
- Generates predicted multiple for target's profile
Example:
Multiple = 2.0 + (0.15 × Growth%) + (0.10 × EBITDA Margin%)

Target: 40% growth, 20% EBITDA margin
Predicted Multiple = 2.0 + (0.15 × 40) + (0.10 × 20)
                   = 2.0 + 6.0 + 2.0
                   = 10.0x
Sum-of-the-Parts (SOTP)
For multi-segment companies:
- Value each segment separately
- Apply appropriate comps to each
- Sum segment values
- Add/subtract corporate costs
Precedent Acquisitions as Comparables
Sometimes treat acquired companies as comps:
- Use pre-acquisition trading multiples
- Adjust for time value
- Consider market conditions at acquisition
- Remember acquired cos traded with takeout premium
References
© 2026 CorpDev.Ai Unified Process for M&A
Last updated: Wed Jan 29 2025 19:00:00 GMT-0500 (Eastern Standard Time)