Precedent Transaction Analysis
Precedent Transaction Analysis ("Transaction Comps" or "M&A Comps") values a company based on the purchase prices paid in comparable M&A transactions. This guide covers how to identify, analyze, and apply precedent transactions to current valuations.
What is Precedent Transaction Analysis?
Definition: Valuation methodology that analyzes the prices paid for similar companies in past M&A transactions to determine an appropriate valuation range.
Core Principle: If Company X was acquired at 8x revenue, and your target is similar to Company X, it should be valued around 8x revenue.
Key Difference from Trading Comps:
- Trading comps = minority stake, public market value
- Transaction comps = control premium, strategic value included
- Transaction multiples typically 20-40% higher than trading multiples
When to Use:
- Negotiating purchase price
- Justifying valuation to board
- Understanding market appetite
- Competitive bid situations
- Setting walk-away price
Advantages:
- Reflects actual M&A market prices
- Includes control premium
- Shows strategic value buyers will pay
- Reality check on valuation
Limitations:
- Each deal is unique (synergies, timing, buyers)
- Historical data may not reflect current market
- Deal details often limited
- Synergies not disclosed
- Small sample sizes
Step-by-Step Process
Step 1: Identify Relevant Transactions
Selection Criteria:
Industry/Sector (Critical):
- Same or closely related industry
- Similar business model
- Comparable products/services
- Same end markets
Size:
- Revenue within 0.25x - 3x of target
- More lenient than trading comps
- Consider enterprise value too
Timing:
- Last 2-3 years preferred
- Up to 5 years if limited data
- Avoid very old transactions (market changes)
- Consider market conditions at time
Geography:
- Same or similar markets
- Consider cross-border premium/discount
- Regulatory environment
Transaction Type:
- Strategic vs. financial buyer
- Stock vs. cash consideration
- Public vs. private target
- Competitive auction vs. negotiated
Deal Status:
- Completed transactions preferred
- Announced but pending can be included
- Avoid terminated deals
Target Universe: 8-15 transactions (fewer than trading comps)
Example - SaaS Company Target:
Target Profile:
- Vertical SaaS for healthcare providers
- $50M ARR, 40% growth
- 75% gross margin, breaking even on EBITDA
- 1,200 customers, mostly SMB
Selected Precedent Transactions:
- Phreesia acquired HealthCare Software Co ($240M revenue) - 2023
- Oracle acquired Cerner ($5B revenue) - 2022
- Nordic Capital acquired Cority ($150M revenue) - 2023
- Vista Equity acquired Greenway ($520M revenue) - 2023
- Thoma Bravo acquired Qventus ($80M revenue) - 2024
- Providence Equity acquired Definitive Healthcare - 2023
- Blackstone acquired MedHOK ($200M revenue) - 2022
Step 2: Gather Transaction Details
Required Information:
Deal Terms:
- Announcement date
- Close date (if completed)
- Purchase price / enterprise value
- Form of consideration (cash, stock, mix)
- Earnout or contingent consideration
Target Company Financials:
- LTM revenue at time of acquisition
- NTM revenue projections (if available)
- EBITDA (LTM and/or NTM)
- EBIT
- Growth rate (historical)
- Margins
Transaction Context:
- Buyer identity and type (strategic vs. PE)
- Competitive process (auction vs. negotiated)
- Strategic rationale disclosed
- Synergy expectations (if disclosed)
Data Sources:
Public Sources:
- SEC filings (Form S-4, proxy statements)
- Press releases
- Earnings call transcripts
- News articles
Databases:
- Capital IQ M&A Database
- PitchBook
- FactSet M&A
- MergerMarket
- 451 Research (for tech)
- Refinitiv (formerly Thomson Reuters)
Challenges:
- Private company targets = limited disclosure
- Synergies rarely disclosed
- Earnouts often confidential
- Working capital adjustments unknown
Step 3: Calculate Transaction Multiples
Enterprise Value Multiples:
EV / LTM Revenue:
Transaction Enterprise Value / Last Twelve Months Revenue
EV / NTM Revenue:
Transaction Enterprise Value / Next Twelve Months Revenue
EV / LTM EBITDA:
Transaction Enterprise Value / Last Twelve Months EBITDA
Calculating Enterprise Value:
Equity Purchase Price
+ Debt Assumed
- Cash Acquired
+ Transaction Fees and Costs (if included)
+ Earnouts (sometimes included at full value)
= Transaction Enterprise Value
Example Calculation:
Purchase Price:            $300M (80% cash, 20% stock)
+ Debt Assumed:            $15M
- Cash Acquired:           ($25M)
+ Earnout (full value):    $50M

Transaction EV:            $340M

Target LTM Revenue:        $60M
Target LTM EBITDA:         $8M

EV / Revenue:              5.7x
EV / EBITDA:              42.5x
Step 4: Build Transaction Comparable Table
Example Transaction Comps Table:
                                                                                    EV /        EV /       Target  Target
Target                 Acquirer           Date      EV ($M)   Revenue ($M)   EBITDA ($M)    Revenue     EBITDA     Growth  Margin
──────────────────────────────────────────────────────────────────────────────────────────────────────────────────────────────────
HealthCare SW Co       Phreesia          Q1 2023    $1,800      $240           $48          7.5x        37.5x      35%     20%
Cerner                 Oracle            Q2 2022    $28,300     $5,500         $1,375       5.1x        20.6x      6%      25%
Cority                 Nordic Cap        Q3 2023    $1,200      $150           $30          8.0x        40.0x      28%     20%
Greenway               Vista Equity      Q1 2023    $1,560      $520           $104         3.0x        15.0x      8%      20%
Qventus                Thoma Bravo       Q2 2024    $720        $80            $5           9.0x        144.0x     45%     6%
Definitive HC          Providence        Q4 2023    $4,200      $350           $105         12.0x       40.0x      25%     30%
MedHOK                 Blackstone        Q3 2022    $1,600      $200           $40          8.0x        40.0x      22%     20%

25th Percentile                                                                                5.1x        20.6x
Median                                                                                         7.5x        40.0x
75th Percentile                                                                                8.5x        41.3x
Mean                                                                                           7.5x        48.2x
──────────────────────────────────────────────────────────────────────────────────────────────────────────────────────────────────

Your Target                                         $50        $5                            ?           ?          40%     10%
Step 5: Analyze and Adjust Multiples
Factors Impacting Transaction Multiples:
Buyer Type:
- Strategic buyers: Pay more (synergies), 20-40% premium
- Financial buyers (PE): More disciplined, return-focused
- Corporate PE: Hybrid approach
Deal Process:
- Competitive auction: Higher multiples (10-30% premium)
- Negotiated sale: Lower multiples, but may get better terms
- Pre-emptive bid: Premium to avoid auction
Market Conditions:
- Bull market: Higher multiples
- Bear market: Lower multiples
- Low interest rates: Higher multiples (cheaper financing)
- Hot sector: Premium multiples
Target Characteristics:
- Growth rate: Higher growth = higher multiple
- Profitability: Better margins = higher multiple
- Customer quality: Stickier customers = premium
- Market position: Leaders command premium
- Management team: Strong team adds value
Urgency/Motivation:
- Distressed sale: Discounted price
- Strategic necessity: Premium price
- Founder liquidity event: May accept lower price
- Competitive threat: Premium to secure deal
Size:
- Larger deals often at lower multiples
- Smaller deals may have scarcity premium
- Adjust for size differences
Consideration Type:
- All cash: Typically values higher
- Stock consideration: Subject to market risk, may discount
- Earnouts: Discounted value (risk of non-payment)
Step 6: Apply Adjusted Multiples to Target
Method 1: Simple Range Application
Target LTM Revenue: $50M

Transaction Multiples:
- 25th Percentile: 5.1x
- Median: 7.5x
- 75th Percentile: 8.5x

Implied EV Range:
- Low (25th %ile): $255M
- Mid (Median): $375M
- High (75th %ile): $425M
Method 2: Adjust for Target Characteristics
Median Transaction Multiple: 7.5x EV/Revenue

Adjustments:
+ Higher growth (40% vs 25% median): +1.0x
- Lower profitability (10% vs 20% median margins): -0.8x
+ Competitive auction expected: +0.5x
- Smaller size: -0.5x

Adjusted Multiple: 7.7x
Target Revenue: $50M

Implied EV: $385M
Method 3: Regression-Based
Run regression: Transaction Multiple = f(Growth, Margin, Size, Year)

Predict multiple based on target's characteristics
Step 7: Compare to Trading Comps
Implied Control Premium:
Transaction Multiple - Trading Multiple = Control Premium

Example:
Transaction EV/Revenue: 7.5x
Trading Comp EV/Revenue: 5.8x
Implied Premium: 29%

Typical Range: 20-35%
Triangulate Value:
                        Low         Mid         High
Trading Comps (Minority) $280M      $320M       $360M
Control Premium (25%)    $70M       $80M        $90M
Transaction Comps        $320M      $375M       $425M
Key Considerations
Transaction Synergies
Problem: Disclosed multiples may include buyer-specific synergies
Analysis:
- Try to identify synergy potential from deal rationale
- Adjust multiples downward if massive synergies expected
- Consider your company's synergy potential
Example:
Announced Deal: $400M (10x revenue)
Disclosed synergies: $100M PV
Standalone value: ~$300M (7.5x revenue)

Your synergies: $60M PV
Justified price: ~$360M (9x revenue)
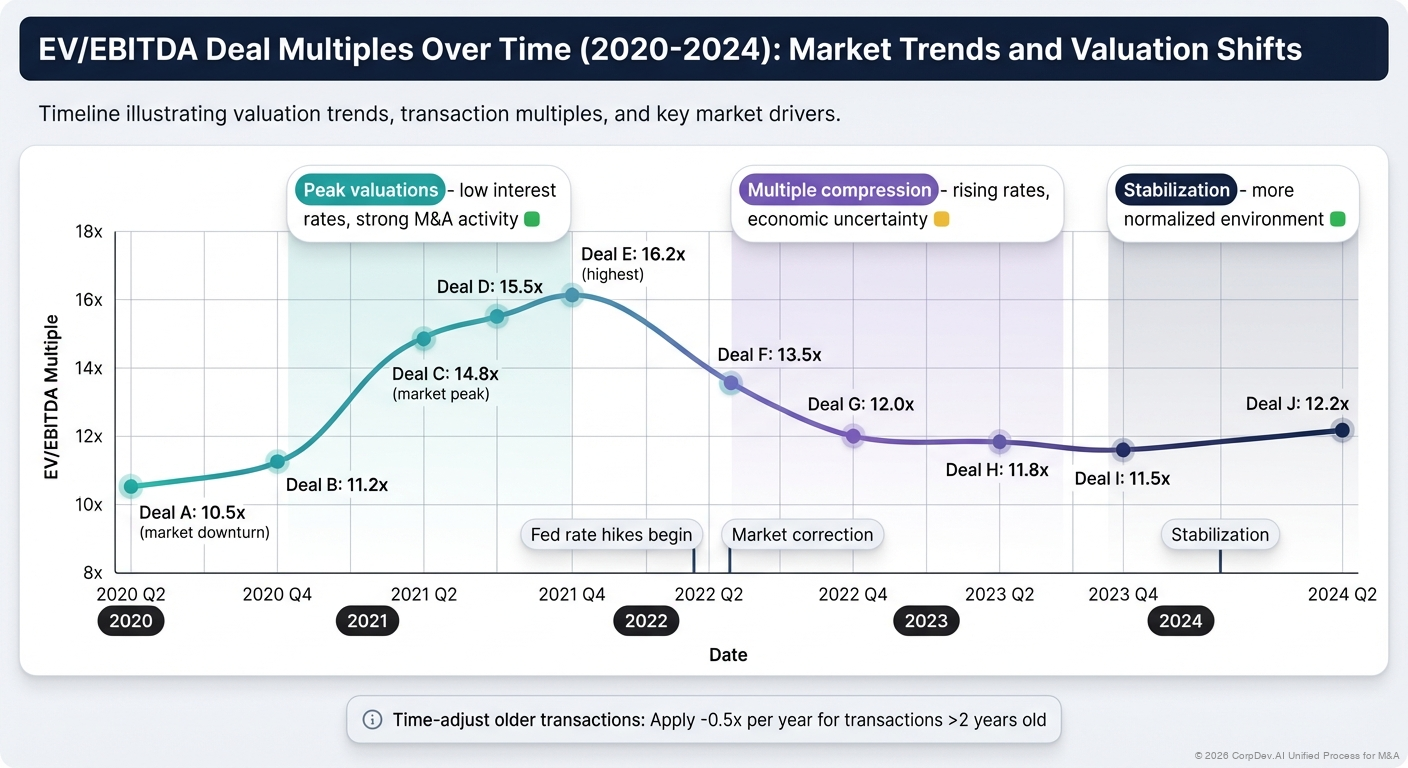
Market Timing Adjustments
Older Transactions:
- Adjust for market multiple expansion/contraction
- Use public market indices as reference
Example:
Transaction from 2021: 12x EV/Revenue
SaaS index was at 15x then, now at 8x
Adjusted multiple: 12x × (8x / 15x) = 6.4x
Earnout Considerations
Treatment:
- Sometimes earnouts included at full value in reported EV
- Sometimes excluded
- Risk-adjust earnouts (typically 50-70% of max value)
Example:
Reported Deal Value: $100M
Base: $70M
Earnout (max): $30M

Realistic earnout value: $20M (67% of max)
Effective EV: $90M

Use $90M for multiple calculations
Limited Data Quality
Private Target Limitations:
- Financials often not disclosed
- May only know purchase price
- Estimates from industry sources
- Triangulate with known data points
Strategies:
- Use deals with disclosed financials
- Apply industry benchmarks for missing data
- Focus on deals with better disclosure
- Be transparent about data quality
Putting It All Together: Football Field
Visual Valuation Range:
Methodology                    Low ├─────────────┤ High

DCF Analysis            $300M ████████████████████ $420M

Trading Comps           $280M ██████████████████ $360M
+ Control Premium (25%)        ██████████████████████ $450M
= Implied Transaction   $350M ████████████████████████ $450M

Precedent Transactions  $320M ████████████████████████ $425M

────────────────────────────────────────────────────────
Valuation Range         $320M ████████████████████████ $425M
                              Recommended: $375M - $400M
Common Pitfalls
1. Ignoring Market Conditions
Problem: Using 2021 multiples in 2024 downturn
Solution: Adjust for market changes, consider macro environment
2. Mixing Buyer Types
Problem: Comparing strategic deal to financial buyer deal
Solution: Segment by buyer type, understand buyer's motivation
3. Not Accounting for Deal Structure
Problem: Treating all-cash deal same as stock deal
Solution: Adjust for consideration type, earnout risk
4. Overlooking Synergies
Problem: Assuming precedent multiple is standalone value
Solution: Try to identify synergy component, adjust accordingly
5. Small Sample Size
Problem: Only 2-3 relevant transactions
Solution: Expand criteria carefully, supplement with trading comps
6. Cherry-Picking High Multiples
Problem: Only citing the highest multiple transactions
Solution: Show full range, use median, explain outliers
7. Ignoring Failed Deals
Problem: Only looking at completed deals
Solution: Consider why some deals didn't close, understand limits
Best Practices
1. Recent and Relevant
Prioritize transactions from last 2 years in same sector
2. Understand the Why
Research deal rationale - synergies, strategic fit, competitive dynamics
3. Multiple Perspectives
Look at both EV/Revenue and EV/EBITDA if applicable
4. Document Everything
Track sources, assumptions, adjustments transparently
5. Triangulate
Never rely solely on transaction comps - use with DCF and trading comps
6. Sensitivity Analysis
Show how valuation changes with different multiple selections
7. Tell the Story
Explain to stakeholders how transactions relate to your situation
Advanced Analysis
Deal Wave Analysis
Track multiples over time in your sector:
Period          Median EV/Revenue    # of Deals
2019            6.5x                 45
2020            7.2x                 38
2021            10.5x                67
2022            8.1x                 41
2023            6.8x                 35
2024 YTD        7.0x                 28

Current environment: 7.0x (below 5-year average of 7.8x)
Strategic vs. Financial Buyer Analysis
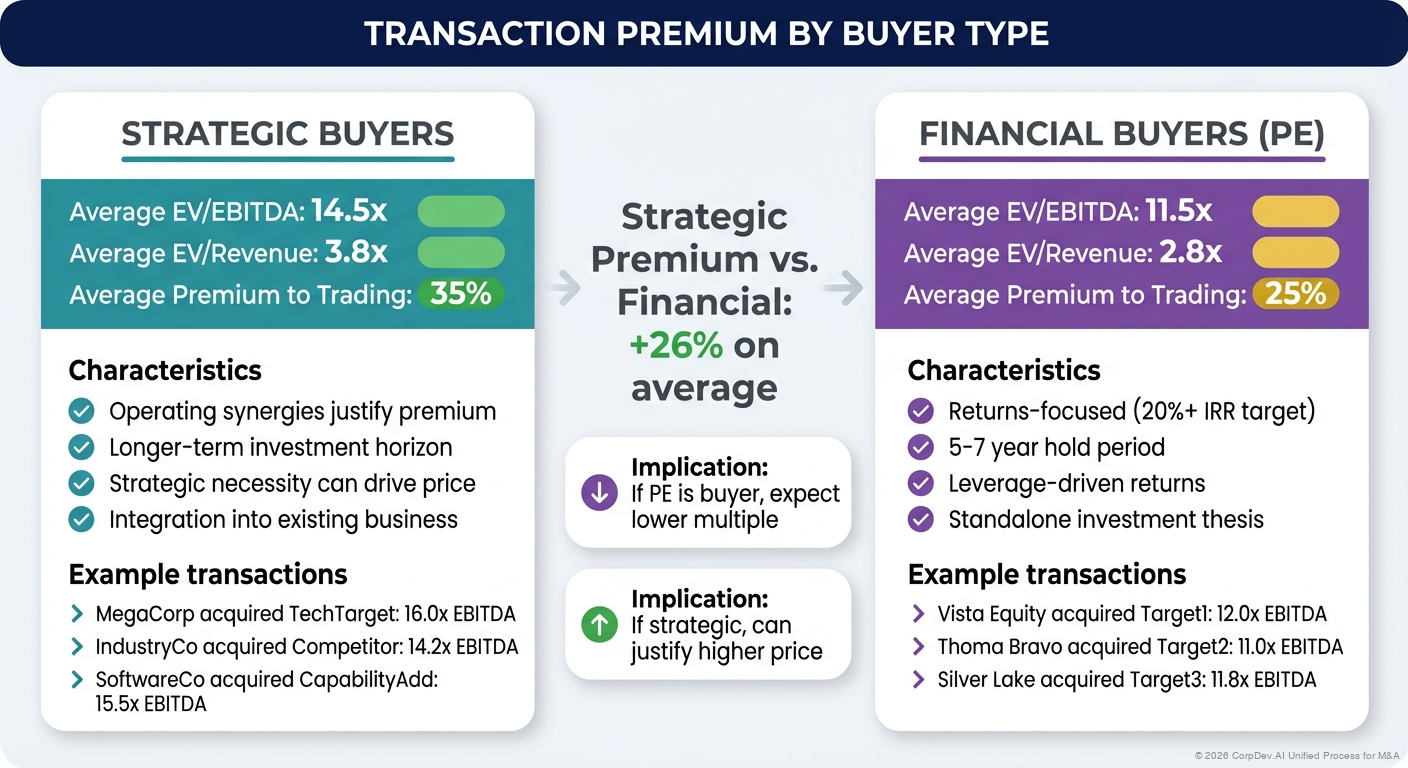
Buyer Type      Avg Multiple    Premium vs. Financial
Strategic       8.5x            +25%
Financial (PE)  6.8x            baseline
Corporate PE    7.5x            +10%
Size-Adjusted Analysis
Deal Size          Avg EV/Revenue Multiple
< $100M            9.5x
$100-500M          7.2x
$500M - $1B        6.5x
> $1B              5.8x
Competitive Process Impact
Process Type           Avg Premium
Broad Auction          Base
Targeted Auction       -8%
Negotiated Sale        -15%
Pre-emptive Offer      +12%
Precedent Transactions Checklist
Before finalizing analysis, verify:
- Selected transactions are truly comparable
- Financials are from same time period (all LTM or all NTM)
- Enterprise values calculated consistently
- Synergies considered and adjusted for
- Market timing differences accounted for
- Deal structure differences noted
- Control premium vs. trading comps makes sense
- Sample size is adequate (ideally 8-12 deals)
- Outliers identified and explained
- Data sources documented
- Results triangulated with other methods
Example: Complete Analysis
Target: Healthcare IT SaaS company, $50M revenue, 40% growth
Selected Transactions (7 deals, past 2 years)
Multiple Analysis:
EV / Revenue Multiples:
- Low: 5.1x
- 25th Percentile: 6.8x
- Median: 7.5x
- 75th Percentile: 8.5x
- High: 12.0x (outlier - strategic necessity deal)

Excluding outlier:
- Adjusted Median: 7.5x
- Mean: 7.3x
Adjustments:
Base (Median): 7.5x
+ Higher growth (+1.0x)
- Smaller size (-0.5x)
+ Competitive buyer interest (+0.5x)
= Adjusted: 8.5x
Valuation:
EV/Revenue Multiple: 7.5x - 8.5x
Target Revenue: $50M
Implied EV: $375M - $425M

Midpoint: $400M
Compare to Trading Comps:
Trading Comp EV/Revenue: 6.0x
Implied EV: $300M
Control Premium: 33% ($100M)

Supports transaction comp range
Recommendation:
Valuation Range: $375M - $425M
Target Price: $400M
Walk-Away Price: $450M
References
© 2026 CorpDev.Ai Unified Process for M&A
Last updated: Wed Jan 29 2025 19:00:00 GMT-0500 (Eastern Standard Time)