Investment Committee Presentations for M&A
The Investment Committee (IC) presentation is your opportunity to secure approval for an M&A transaction. A well-crafted IC deck tells a compelling story, addresses concerns head-on, and demonstrates rigorous analysis.
What is an IC Presentation?
Purpose
An IC presentation (also called Board presentation for larger deals) is a formal pitch to decision-makers requesting approval to:
- Execute a Letter of Intent (LOI)
- Proceed with full due diligence
- Submit binding offer
- Execute definitive agreement
- Close transaction
Typical Audience
- Investment Committee: CFO, CEO, COO, Head of Corp Dev, Business Unit leads
- Board of Directors (deals >$X threshold or strategic importance)
- Private Equity IC (for PE-backed companies or PE buyers)
Decision Criteria
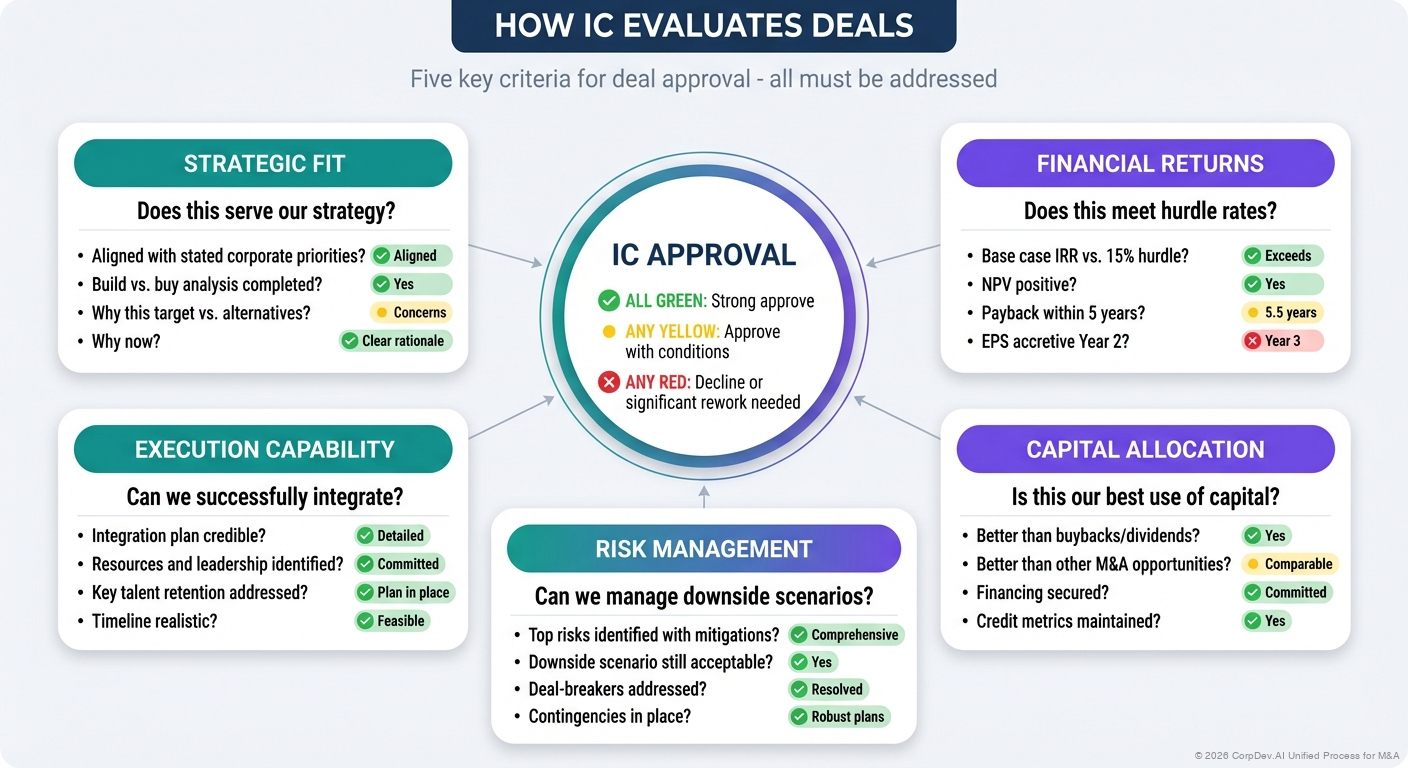
IC evaluates deals on:
- Strategic Fit: Does this serve our strategy?
- Financial Returns: Does this meet hurdle rates?
- Risk: Can we manage downside scenarios?
- Execution: Can we successfully integrate?
- Alternatives: Is this our best use of capital?
Great IC presentations are: (1) Concise - 15-25 slides, (2) Fact-based - data over opinions, (3) Balanced - acknowledge risks, (4) Clear - simple language, strong visuals, (5) Actionable - specific recommendation and ask.
IC Presentation Structure
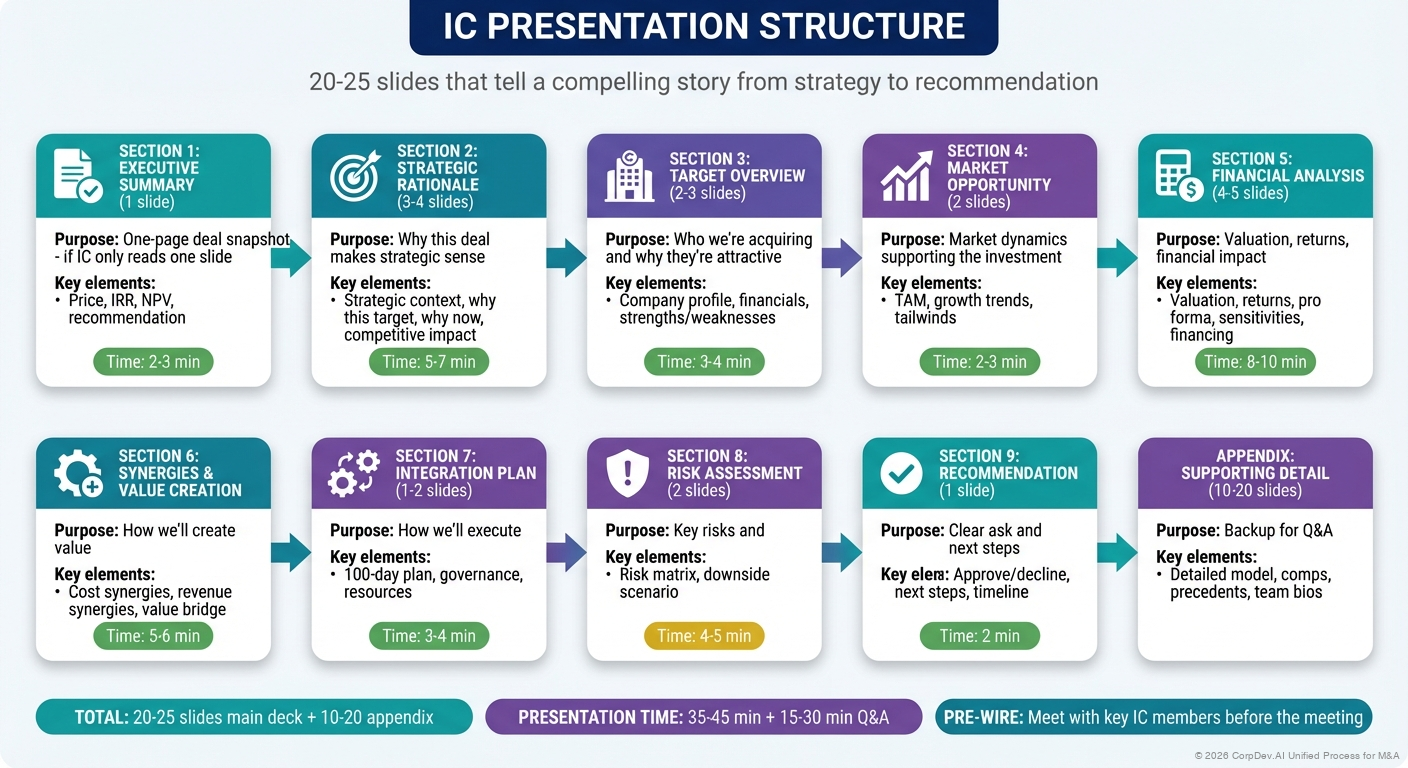
Recommended Flow (20-25 Slides)
| Section | Slides | Purpose |
|---|---|---|
| 1. Executive Summary | 1 | One-page deal snapshot |
| 2. Strategic Rationale | 3-4 | Why this deal makes strategic sense |
| 3. Target Overview | 2-3 | Who we're acquiring and why they're attractive |
| 4. Market Opportunity | 2 | Market dynamics supporting the investment |
| 5. Financial Analysis | 4-5 | Valuation, returns, financial impact |
| 6. Synergies & Value Creation | 2-3 | How we'll create value |
| 7. Integration Plan | 1-2 | How we'll execute |
| 8. Risk Assessment | 2 | Key risks and mitigations |
| 9. Recommendation | 1 | Clear ask and next steps |
| Appendix | 10-20 | Supporting detail for Q&A |
Slide-by-Slide Breakdown
Slide 1: Executive Summary
The "If You Only Read One Slide" Page
┌────────────────────────────────────────────────────────┐
│  EXECUTIVE SUMMARY: [Target Name] Acquisition          │
├────────────────────────────────────────────────────────┤
│                                                         │
│  TRANSACTION OVERVIEW                                  │
│  • Target: [Name], [description in 1 sentence]        │
│  • Purchase Price: $[X]M ([X.X]x Revenue, [X.X]x EBITDA) │
│  • Structure: [Cash/Stock/Mix]                         │
│  • Expected Close: [Q/Year]                            │
│                                                         │
│  STRATEGIC RATIONALE                                   │
│  [2-3 bullets summarizing why this deal makes sense]  │
│                                                         │
│  FINANCIAL RETURNS (BASE CASE)                         │
│  • IRR: [X]% (vs. [X]% hurdle)                        │
│  • NPV: $[X]M                                          │
│  • EPS Impact (Year 2): [X]% accretive               │
│  • Payback: [X] years                                  │
│                                                         │
│  KEY RISKS & MITIGATIONS                               │
│  [Top 2 risks with 1-line mitigation each]            │
│                                                         │
│  RECOMMENDATION                                        │
│  [✓ Approve / Approve with conditions / Decline]      │
│                                                         │
└────────────────────────────────────────────────────────┘
Best Practices
- This slide should stand alone if it's all IC reads
- Use specific numbers, not ranges or vague language
- Bold the "big number" metrics (IRR, NPV, Price)
- State recommendation clearly (don't bury it)
Slides 2-5: Strategic Rationale
Slide 2: Strategic Context
Show where company is today and strategic gap:
OUR STRATEGIC PRIORITIES          TARGET ADDRESSES
┌─────────────────────┐          ┌─────────────────────┐
│ 1. Enter cloud security  →  Provides market-leading  │
│    market                       cloud security platform│
│                                                         │
│ 2. Expand enterprise     →  650 enterprise customers  │
│    customer base                with $50K+ ACV        │
│                                                         │
│ 3. Accelerate SaaS       →  85% recurring revenue,    │
│    transition                   cloud-native stack    │
└─────────────────────┘          └─────────────────────┘
Slide 3: Why This Deal / Why Now
| Question | Answer |
|---|---|
| Why This Target? | [Unique capabilities, market position, or assets vs. alternatives] |
| Why Not Build? | [Time/risk/cost rationale - e.g., "Would take 3+ years and $100M+ with high execution risk"] |
| Why Now? | [Market timing, competitive dynamics, window of opportunity] |
Slide 4: Strategic Archetype
Clearly state primary strategic driver:
Capability Acquisition - Technology
Acquire market-leading cloud security platform with proprietary AI-powered threat detection, enabling us to compete for enterprise-wide security contracts worth $500M+ annually. This technology would take 3+ years and $100M+ to build organically, with uncertain competitive positioning.
Slide 5: Competitive Positioning
Show how deal strengthens competitive position:
CURRENT STATE              POST-ACQUISITION
  ┌─────────┐                  ┌─────────┐
  │ Player A│ 30%              │   US    │ 28%
  ├─────────┤                  ├─────────┤
  │ Player B│ 22%              │ Player A│ 25%
  ├─────────┤          →       ├─────────┤
  │   US    │ 15%              │ Player B│ 22%
  ├─────────┤                  ├─────────┤
  │ Target  │ 13%              │ Others  │ 25%
  ├─────────┤                  └─────────┘
  │ Others  │ 20%
  └─────────┘

RANK: #3 → #1               SHARE: 15% → 28%
Slides 6-8: Target Overview
Slide 6: Target Company Profile
┌────────────────────────────────────────────────────────┐
│  [COMPANY LOGO]                                        │
│                                                         │
│  COMPANY OVERVIEW                                      │
│  • Founded: [Year] │ HQ: [Location] │ Employees: [X]  │
│  • [1-sentence description of what company does]       │
│                                                         │
│  FINANCIAL HIGHLIGHTS (LTM)                            │
│  • Revenue: $[X]M (+[X]% YoY)                         │
│  • EBITDA: $[X]M ([X]% margin)                        │
│  • ARR: $[X]M ([X]% recurring)                         │
│                                                         │
│  KEY METRICS                                           │
│  • Customers: [X] ([X]% enterprise, [X]% SMB)         │
│  • NRR: [X]%                                           │
│  • CAC Payback: [X] months                             │
│  • Rule of 40: [X]                                     │
│                                                         │
│  COMPETITIVE POSITION                                  │
│  • Market share: [X]% ([#X] player in $[X]B market)   │
│  • Key differentiators: [2-3 bullets]                  │
│                                                         │
└────────────────────────────────────────────────────────┘
Slide 7: Target Financial Performance
Show historical and projected performance:
REVENUE & GROWTH                    EBITDA MARGIN
$150M  ┃                            30% ┃
       ┃     ██                          ┃     ╱╱
$100M  ┃   ██  ██                    20% ┃   ╱╱
       ┃ ██      ██                      ┃ ╱╱
$50M   ┃                            10% ┃
       ┗━━━━━━━━━━━━                     ┗━━━━━━━━━━━━
       2021 2022 2023 2024E            2021 2022 2023 2024E

       +25% +32% +28% +25%              18%  22%  25%  27%
Slide 8: Target Strengths & Weaknesses
| Strengths (Why Attractive) | Weaknesses/Risks (What We Fix) |
|---|---|
| ✓ Market-leading technology | ✗ Limited go-to-market resources |
| ✓ Strong customer retention (95% NRR) | ✗ Geographic concentration (85% US) |
| ✓ Proven management team | ✗ Underinvested in product (opportunity) |
| ✓ Scalable SaaS platform | ✗ Weak international presence |
Slides 9-10: Market Opportunity
Slide 9: Market Size & Growth
TOTAL ADDRESSABLE MARKET (TAM)

$50B ┃
     ┃                      ██
$40B ┃                    ██
     ┃                  ██
$30B ┃                ██
     ┃              ██  ← $42B by 2027
$20B ┃            ██      15% CAGR
     ┃          ██
$10B ┃        ██
     ┃      ██ ← $18B today
     ┗━━━━━━━━━━━━━━━━━━━━━━━
     2023    2024    2025    2026    2027

COMBINED SHARE: 2.8% → Significant runway for growth
Slide 10: Market Trends & Tailwinds
KEY MARKET DRIVERS

1. 📈 Cloud Migration Accelerating
   - 70% of enterprises migrating to cloud by 2025
   - Security spending growing 2x faster than overall IT

2. 🔒 Regulatory Requirements Increasing
   - GDPR, CCPA, SOC2 driving security investment
   - Compliance spending up 25% YoY

3. 🎯 Consolidation Preference
   - CIOs prefer integrated platforms vs. point solutions
   - Average enterprise uses 50+ security tools (reducing to 10-15)

4. 💰 Favorable Pricing Environment
   - Willingness to pay for AI-powered security
   - Security budgets resilient even in downturn
Slides 11-15: Financial Analysis
Slide 11: Valuation Summary
VALUATION ANALYSIS

Method                  Implied Value    Weight    Weighted Value
─────────────────────   ──────────────   ──────   ──────────────
DCF (WACC 10.5%)        $450M - $550M     40%         $500M
Comparable Companies    $420M - $520M     30%         $470M
Precedent Transactions  $480M - $580M     30%         $530M
                                                   ─────────────
FAIR VALUE RANGE                                      $490M


PURCHASE PRICE: $500M

Valuation Multiples:
• EV/Revenue (LTM):     3.5x  (vs. comps median 3.2x)
• EV/EBITDA (LTM):     11.5x  (vs. comps median 10.8x)
• EV/ARR:               4.0x  (vs. SaaS median 4.2x)

ASSESSMENT: ✓ Fair value, slight premium justified by strategic fit
Slide 12: Returns Analysis
BASE CASE FINANCIAL RETURNS

┌──────────────────┬────────────┬────────────┬────────────┐
│ Metric           │ Base Case  │ Upside     │ Downside   │
├──────────────────┼────────────┼────────────┼────────────┤
│ IRR              │   18.5%    │   24.2%    │   12.1%    │
│ NPV              │  $120M     │  $250M     │   $40M     │
│ Payback Period   │   4.2 yrs  │   3.1 yrs  │   6.5 yrs  │
│ ROIC (Year 3)    │   14.2%    │   18.5%    │    9.8%    │
│ EPS Accretion Y2 │    8.5%    │   12.0%    │    3.2%    │
└──────────────────┴────────────┴────────────┴────────────┘

Probability Weight:     60%         20%         20%

HURDLE RATE: 15% IRR
BASE CASE: 18.5% IRR → ✓ Clears hurdle with 350bps margin

DOWNSIDE STILL ACCEPTABLE: 12.1% IRR (still positive NPV)
Slide 13: Pro Forma Financial Impact
PRO FORMA P&L (YEAR 2)

($M)              Acquirer  Target  Synergies  Pro Forma  % Change
───────────────   ────────  ──────  ─────────  ─────────  ────────
Revenue             $2,000    $500       $50     $2,550     +27.5%
EBITDA                $400    $100      $110       $610     +52.5%
EBITDA Margin         20.0%   20.0%       -       23.9%    +390bps


BALANCE SHEET IMPACT

Metric              Pre-Deal  Post-Deal  Target    Achieved by
──────────────────  ────────  ─────────  ──────   ─────────────
Net Debt/EBITDA        1.3x      2.8x     <3.0x    Day 1 ✓
EBITDA/Interest       12.0x      8.5x     >5.0x    Day 1 ✓
Projected Year 3       1.3x      1.8x     <2.0x    Month 36 ✓

CREDIT RATING: Maintain BBB (per rating agency pre-wire)
Slide 14: Sensitivity Analysis
IRR SENSITIVITY TO KEY ASSUMPTIONS

                    -20%      -10%     Base     +10%     +20%
────────────────  ────────  ────────  ──────  ────────  ────────
Revenue Growth      14.2%     16.1%    18.5%    20.7%     23.1%
Synergy Capture     12.8%     15.8%    18.5%    21.0%     23.2%
Exit Multiple       15.1%     16.9%    18.5%    19.8%     21.0%
Integration Costs   19.8%     19.1%    18.5%    17.9%     17.2%

KEY INSIGHTS:
• Most sensitive to revenue growth and synergy capture
• Still >12% IRR even with 20% reduction in key assumptions
• Upside scenario (all +10%) delivers 22%+ IRR
Slide 15: Sources & Uses / Financing
SOURCES & USES OF FUNDS

Sources              $M        Uses                    $M
─────────────────  ──────    ─────────────────────  ──────
Cash on Hand         $240    Purchase Price           $500
New Term Loan        $300    Refinance Target Debt    $100
                             Transaction Costs         $40
─────────────────  ──────    ─────────────────────  ──────
Total Sources        $540    Total Uses               $540


FINANCING PLAN
• New 5-year term loan: $300M @ L+275bps
• Pro forma leverage: 2.8x Net Debt/EBITDA
• Committed financing from [Bank Name]
• Deleveraging plan: <2.0x by Year 3 through FCF
• Maintains investment grade rating (BBB)
Slides 16-18: Synergies & Value Creation
Slide 16: Synergy Summary
3-YEAR SYNERGY PLAN

                        Year 1    Year 2    Year 3   Run-Rate
─────────────────────  ───────   ───────   ───────  ─────────
COST SYNERGIES
Headcount Reduction      $7M       $18M      $22M      $22M
Procurement Savings      $3M        $8M      $10M      $10M
IT Consolidation         $1M        $2M       $3M       $3M
Facility Rationalization $0         $3M       $5M       $5M
                       ──────    ───────   ───────   ───────
Total Cost Synergies    $11M       $31M      $40M      $40M


REVENUE SYNERGIES
Cross-Sell (Conservative) $3M       $8M      $15M      $15M
                       ──────    ───────   ───────   ───────

TOTAL SYNERGIES         $14M       $39M      $55M      $55M
PV (3-year, 10% disc):  $150M


INTEGRATION COSTS
One-Time Costs          $25M       $20M       $5M      $50M

NET VALUE CREATION: $100M NPV
Slide 17: Synergy Detail by Source
| Initiative | Owner | Year 3 Value | Confidence | Key Actions |
|---|---|---|---|---|
| G&A headcount reduction | CFO | $22M | High | Eliminate 150 duplicative roles in Finance, HR, IT, Legal |
| Procurement consolidation | CPO | $10M | High | Renegotiate AWS, Microsoft, Salesforce contracts with combined volume |
| Cross-sell to acquirer customers | CRO | $15M | Medium | Train 500 AEs, bundle pricing, 15% attach rate on 5K customers |
| Office consolidation | CFO | $5M | Medium | Close 3 of 5 target offices, relocate to acquirer facilities |
| IT systems migration | CIO | $3M | High | Migrate target to acquirer AWS, consolidate monitoring/security tools |
Slide 18: Value Creation Bridge
VALUE CREATION WATERFALL

$600M │                                              ┌─────┐
      │                                              │     │
$500M │                          ┌─────┐            │ Pro │
      │                          │     │   ╱╲       │Forma│
$400M │     ┌─────┐             │Total│  ╱  ╲      │Value│
      │     │Stand│   ╱╲  ╱╲   │Value│ ╱Intg.\     │     │
$300M │     │alone│  ╱  ╲╱  ╲  │     │╱Costs  ╲    │     │
      │     │Value│ ╱Cost Rev.╲│  +  │-       │    │     │
$200M │     │     │╱Syn  Syn. ││Other│ $50M   │    │     │
      │     │     │ $120 $80  ││ $50M│        │    │     │
$100M │     │$400M│     M   M │└─────┘        └────└─────┘
      └─────┴─────┴───────────┘
             │                              │
             └──────────────────────────────┘
                   $200M Value Added

             Less: Purchase Price  -$500M
             ═════════════════════════════
             NET VALUE CREATION:    $100M
Slides 19-20: Integration & Execution
Slide 19: Integration Approach
100-DAY INTEGRATION PLAN

DAY 1-30: STABILIZE
✓ Integration governance launched (Steering Committee, IMO)
✓ Day 1 communications (employees, customers, partners)
✓ Retention packages for 50 critical employees
✓ Quick wins: Procurement contracts, system decommissions

DAY 31-60: EXECUTE CORE SYNERGIES
✓ Headcount decisions communicated
✓ IT migration plan finalized
✓ Office consolidation announced
✓ Sales training on combined portfolio begins

DAY 61-100: SCALE VALUE CAPTURE
✓ Headcount reductions effective
✓ IT migrations Wave 1 complete
✓ Cross-sell pilot launched (20 customers)
✓ Monthly synergy tracking operational

YEAR 1 TARGET: $14M synergies realized, 30% of run-rate
Slide 20: Integration Governance
INTEGRATION ORGANIZATION

┌─────────────────────────────────────────┐
│       Steering Committee                │
│  CEO, CFO, COO (Monthly Reviews)        │
└─────────────────────────────────────────┘
                  │
┌─────────────────────────────────────────┐
│    Integration Management Office        │
│  VP Integration (Dedicated FTE Year 1)  │
│  5-person IMO team                      │
└─────────────────────────────────────────┘
                  │
    ┌─────────────┴─────────────┬─────────────────┐
    │                           │                 │
┌─────────┐              ┌─────────┐        ┌─────────┐
│Finance &│              │  Sales &│        │IT & Ops │
│  G&A    │              │ Revenue │        │         │
│Workstream│             │Workstream│       │Workstream│
└─────────┘              └─────────┘        └─────────┘

DEDICATED RESOURCES: 1 VP + 5 FTE IMO + 15 FTE workstreams
EXTERNAL SUPPORT: [Consulting Firm] for IT migration
Slides 21-22: Risk Assessment
Slide 21: Key Risks & Mitigations
| Risk | Probability | Impact | Mitigation | Residual Risk |
|---|---|---|---|---|
| Customer attrition due to integration uncertainty | Medium | High | • Early customer communications • Retention bonuses for account teams • Executive customer calls |
Medium |
| Talent loss of critical engineers/PMs | Medium | High | • Retention packages for top 50 employees • Clear career paths • Acquirer equity grants |
Low |
| Revenue synergies take longer than expected | High | Medium | • Base case excludes revenue synergies • Deal justified on cost synergies alone |
Low |
| Integration costs exceed budget | Medium | Medium | • 20% contingency in $50M budget • Phased approach to delay non-critical items |
Low |
| Regulatory delay (if applicable) | Low | Medium | • Pre-filed with FTC • Expect 3-month review, standard clearance |
Low |
Slide 22: Downside Scenario Analysis
STRESS TEST: DOWNSIDE SCENARIO

Assumptions (Pessimistic):
• Revenue: 20% below base case (market downturn, customer losses)
• Synergies: Only 50% realized (execution challenges)
• Integration Costs: 2x budget ($100M vs. $50M)
• Timeline: Delayed by 6 months

Downside Results:
┌──────────────────────┬───────────┬────────────┐
│ Metric               │ Base Case │  Downside  │
├──────────────────────┼───────────┼────────────┤
│ IRR                  │   18.5%   │   12.1%    │ ← Still >12%
│ NPV                  │  $120M    │   $40M     │ ← Still positive
│ EPS Accretion (Y2)   │    8.5%   │    3.2%    │ ← Still accretive
│ Net Debt/EBITDA (Y1) │    2.8x   │    3.2x    │ ← Within covenant
└──────────────────────┴───────────┴────────────┘

✓ DOWNSIDE STILL ACCEPTABLE: Positive NPV, >12% IRR, manageable leverage
Slide 23: Recommendation
The Ask
┌────────────────────────────────────────────────────────┐
│                                                         │
│                    RECOMMENDATION                       │
│                                                         │
│  ✓ APPROVE acquisition of [Target Name] for $500M     │
│                                                         │
│  RATIONALE:                                            │
│  1. Strategically aligned: Provides critical cloud     │
│     security capability, 2-3 year time-to-market      │
│     advantage vs. organic build                        │
│                                                         │
│  2. Financially attractive: 18.5% IRR vs. 15% hurdle, │
│     $120M NPV, 8.5% EPS accretive by Year 2           │
│                                                         │
│  3. Manageable risk: Downside scenario still delivers  │
│     12.1% IRR and positive NPV                         │
│                                                         │
│  4. Executable: Detailed integration plan, proven      │
│     team, committed financing                          │
│                                                         │
│  NEXT STEPS:                                           │
│  • Execute Letter of Intent (Week of [Date])          │
│  • 60-day exclusivity period for confirmatory DD      │
│  • Return to IC for binding offer approval            │
│  • Target close: [Q/Year]                              │
│                                                         │
└────────────────────────────────────────────────────────┘
Alternative Format (Traffic Light)
Deal meets all IC approval criteria:
🟢 Strategic Fit: Aligned with cloud security priority
🟢 Financial Returns: 18.5% IRR, clears 15% hurdle
🟢 Risk: Downside manageable, mitigations in place
🟢 Execution: Detailed plan, dedicated resources
🟢 Financing: Committed, maintains IG rating
Recommend proceeding to LOI execution.
Appendix (10-20 Slides)
Essential Backup Slides
Include detailed supporting analysis for Q&A:
- Detailed Financial Model (P&L, BS, CF projections)
- Synergy Detail by Initiative (bottoms-up build)
- Comparable Company Analysis (with metrics table)
- Precedent Transaction Analysis (with multiples)
- Management Team Bios (Target leadership)
- Customer Analysis (top customers, concentration, NRR)
- Product Roadmap (integration plans)
- Technology Stack (compatibility assessment)
- Competitive Landscape (positioning map)
- Market Research (TAM methodology, growth drivers)
- Legal/Regulatory (key contract terms, approval timeline)
- Tax Structure (338(h)(10) vs. stock deal implications)
- Transaction Timeline (key milestones and gates)
- Use of Proceeds (if target has debt or preferred)
- Employee Census (headcount by function, retention risk)
Preparation & Delivery
Pre-Meeting Preparation
2 Weeks Before
- Draft IC deck (complete with appendix)
- Internal review with Corp Dev team
- CFO review of financial analysis
- Legal review of transaction structure
- Identify potential objections
1 Week Before
- Pre-wire with IC members individually
- Incorporate feedback into deck
- Prepare Q&A document (50+ potential questions)
- Practice presentation (30 min main + 30 min Q&A)
- Finalize recommendation and ask
Day Before
- Final deck review and polish
- Send deck to IC 24 hours in advance
- Confirm attendees and logistics
- Prepare backup materials
Pre-Wiring Strategy
Why Pre-Wire?
Pre-wiring = meeting with IC members 1-on-1 before formal presentation to:
- Gauge support and identify concerns
- Incorporate feedback before the meeting
- Build consensus and avoid surprises
- Tailor presentation to address specific concerns
Never go into an IC meeting "cold." Pre-wire with key stakeholders (CFO, CEO, board members) to understand their perspectives and address concerns proactively. Deals with strong pre-wiring support have 3x higher approval rates.
Pre-Wire Template
MEETING: 30-45 minutes with [Name]

OBJECTIVES:
1. Get early feedback on strategic rationale
2. Understand financial return expectations
3. Identify concerns or objections
4. Secure support (or know where resistance is)

KEY DISCUSSION POINTS:
• Strategic fit with corporate priorities
• Financial returns (IRR, NPV, EPS impact)
• Key risks and how we're mitigating
• Integration confidence

QUESTIONS TO ASK:
• "What's your initial reaction to this opportunity?"
• "What would make you most confident in approving this?"
• "What concerns should we address in the IC presentation?"
• "Are there specific analyses you'd like to see?"

OUTCOME:
✓ Supporter / ? Neutral / ✗ Skeptic
Key concerns: [list]
Action items: [what to add/change in deck]
Presentation Delivery Tips
Structure Your Talk Track
Slide 1 (Executive Summary): 2-3 min
- "This is a $500M acquisition of [Target], a market-leading cloud security platform."
- "Strategically, this addresses our #1 priority of entering cloud security."
- "Financially, it delivers 18.5% IRR, well above our 15% hurdle."
- "We're recommending approval to proceed to LOI."
Slides 2-5 (Strategic Rationale): 5-7 min
- Tell the strategic story clearly and concisely
- Connect to stated corporate priorities
- Explain why this target and why now
Slides 6-8 (Target Overview): 3-4 min
- Describe what the company does and why it's attractive
- Highlight key metrics and competitive position
Slides 9-10 (Market): 2-3 min
- Set context on market size and growth
- Briefly cover tailwinds supporting the investment
Slides 11-15 (Financials): 8-10 min
- Walk through valuation, returns, and financial impact
- Be prepared for deep-dive questions here
- Show sensitivity and downside scenarios
Slides 16-18 (Synergies): 5-6 min
- Detail how value will be created
- Be specific about sources and timelines
- Address integration complexity head-on
Slides 19-20 (Integration): 3-4 min
- Show you have a detailed plan
- Highlight governance and resources
Slides 21-22 (Risks): 4-5 min
- Don't shy away from risks
- Show thoughtful mitigations
- Demonstrate downside is still acceptable
Slide 23 (Recommendation): 2 min
- Restate the ask clearly
- Summarize key reasons to approve
- Outline next steps
Total Presentation: 35-45 minutes + 15-30 min Q&A
Delivery Best Practices
✓ Start strong: Open with clear recommendation and executive summary
✓ Tell a story: Connect strategic rationale → financial returns → value creation
✓ Use data: Specific numbers, not hand-waving
✓ Be balanced: Acknowledge risks, don't oversell
✓ Show conviction: Clearly state recommendation and stand behind it
✓ Anticipate questions: Have answers ready (practice Q&A)
✓ Respect time: Stay on schedule, use appendix for detail
✓ Visual clarity: Use charts/graphs, minimize text
✗ Avoid:
- Reading slides verbatim
- Too much detail in main deck (use appendix)
- Hedging on recommendation
- Defensive tone when discussing risks
- Ignoring feedback or questions
- Going over time limit
Handling Q&A
Most Common IC Questions
Strategic Questions
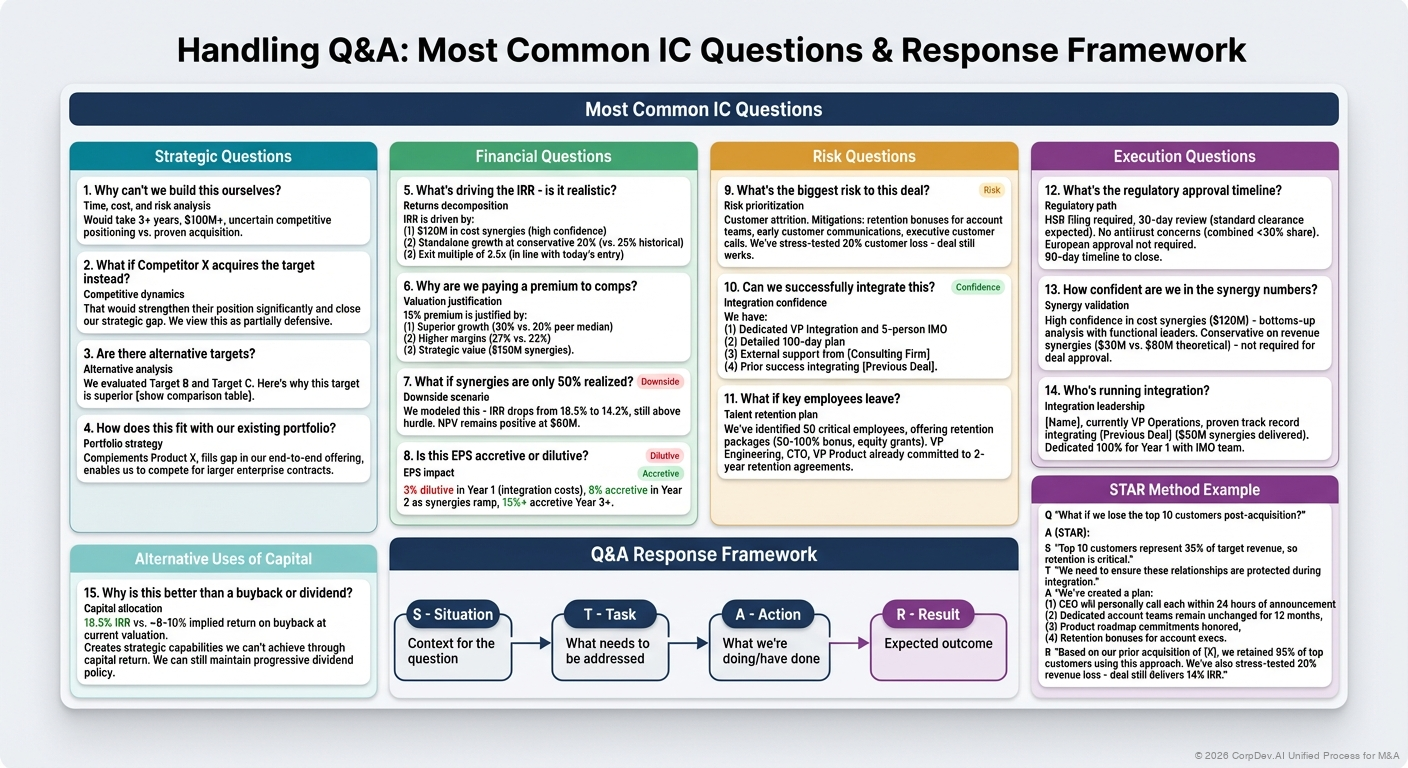
"Why can't we build this ourselves?"
- Answer: Time, cost, and risk analysis. "Would take 3+ years, $100M+, uncertain competitive positioning vs. proven acquisition."
"What if Competitor X acquires the target instead?"
- Answer: Competitive dynamics. "That would strengthen their position significantly and close our strategic gap. We view this as partially defensive."
"Are there alternative targets?"
- Answer: Alternative analysis. "We evaluated Target B and Target C. Here's why this target is superior [show comparison table]."
"How does this fit with our existing portfolio?"
- Answer: Portfolio strategy. "Complements Product X, fills gap in our end-to-end offering, enables us to compete for larger enterprise contracts."
Financial Questions
"What's driving the IRR - is it realistic?"
- Answer: Returns decomposition. "IRR is driven by: (1) $120M in cost synergies (high confidence), (2) Standalone growth at conservative 20% (vs. 25% historical), (3) Exit multiple of 3.5x (in line with today's entry)."
"Why are we paying a premium to comps?"
- Answer: Valuation justification. "15% premium is justified by: (1) Superior growth (30% vs. 20% peer median), (2) Higher margins (27% vs. 22%), (3) Strategic value ($150M synergies)."
"What if synergies are only 50% realized?"
- Answer: Downside scenario. "We modeled this - IRR drops from 18.5% to 14.2%, still above hurdle. NPV remains positive at $60M."
"Is this EPS accretive or dilutive?"
- Answer: EPS impact. "3% dilutive in Year 1 (integration costs), 8% accretive in Year 2 as synergies ramp, 15%+ accretive Year 3+."
Risk Questions
"What's the biggest risk to this deal?"
- Answer: Risk prioritization. "Customer attrition. Mitigations: retention bonuses for account teams, early customer communications, executive customer calls. We've stress-tested 20% customer loss - deal still works."
"Can we successfully integrate this?"
- Answer: Integration confidence. "We have: (1) Dedicated VP Integration and 5-person IMO, (2) Detailed 100-day plan, (3) External support from [Consulting Firm], (4) Prior success integrating [Previous Deal]."
"What if key employees leave?"
- Answer: Talent retention plan. "We've identified 50 critical employees, offering retention packages (50-100% bonus, equity grants). VP Engineering, CTO, VP Product already committed to 2-year retention agreements."
Execution Questions
"What's the regulatory approval timeline?"
- Answer: Regulatory path. "HSR filing required, 30-day review (standard clearance expected). No antitrust concerns (combined <30% share). European approval not required. 90-day timeline to close."
"How confident are we in the synergy numbers?"
- Answer: Synergy validation. "High confidence in cost synergies ($120M) - bottoms-up analysis with functional leaders. Conservative on revenue synergies ($30M vs. $80M theoretical) - not required for deal approval."
"Who's running integration?"
- Answer: Integration leadership. "[Name], currently VP Operations, proven track record integrating [Previous Deal] ($50M synergies delivered). Dedicated 100% for Year 1 with IMO team."
Alternative Uses of Capital
- "Why is this better than a buyback or dividend?"
- Answer: Capital allocation. "18.5% IRR vs. ~8-10% implied return on buyback at current valuation. Creates strategic capabilities we can't achieve through capital return. We can still maintain progressive dividend policy."
Q&A Response Framework
STAR Method
- Situation: Context for the question
- Task: What needs to be addressed
- Action: What we're doing/have done
- Result: Expected outcome
Example:
Q: "What if we lose the top 10 customers post-acquisition?"
A (STAR):
- Situation: "Top 10 customers represent 35% of target revenue, so retention is critical."
- Task: "We need to ensure these relationships are protected during integration."
- Action: "We've created a plan: (1) CEO will personally call each within 24 hours of announcement, (2) Dedicated account teams remain unchanged for 12 months, (3) Product roadmap commitments honored, (4) Retention bonuses for account execs."
- Result: "Based on our prior acquisition of [X], we retained 95% of top customers using this approach. We've also stress-tested 20% revenue loss - deal still delivers 14% IRR."
IC Presentation Checklist
Content Checklist
- Executive summary clearly states recommendation and key metrics
- Strategic rationale connects to corporate priorities
- Why this target articulated vs. alternatives
- Market opportunity sized and validated
- Financial returns show IRR, NPV, payback, and EPS impact
- Valuation benchmarked against multiple methodologies
- Sensitivity analysis shows range of outcomes
- Downside scenario demonstrates acceptable risk
- Synergies detailed by source with ownership
- Integration plan outlines 100-day plan and governance
- Risk assessment identifies top risks with mitigations
- Financing plan includes sources/uses and credit impact
- Recommendation is clear and actionable
- Appendix has detailed backup for all analyses
Preparation Checklist
- Pre-wired with CFO, CEO, and key IC members
- Incorporated feedback from pre-wires into deck
- Prepared Q&A document with 50+ questions
- Practiced presentation (timed, under 45 min)
- Identified potential objections and prepared responses
- Financial model reviewed by CFO and finance team
- Legal review of transaction structure complete
- Deck sent to IC 24+ hours in advance
- Backup materials ready (detailed model, comps, etc.)
- Attendee list confirmed
Delivery Checklist
- Start with clear recommendation
- Tell compelling strategic story
- Use visuals effectively (charts, not walls of text)
- Stay on time (respect the agenda)
- Acknowledge risks honestly
- Demonstrate conviction in recommendation
- Answer questions directly and confidently
- Use appendix for detailed answers
- Summarize next steps if approved
- Follow up with action items and timeline
Example IC Presentation Outline
Acquisition of CloudSecure Inc.
EXECUTIVE SUMMARY
- Target: CloudSecure, market-leading cloud security platform
- Price: $500M (3.5x Revenue, 11.5x EBITDA)
- Returns: 18.5% IRR, $120M NPV, 8.5% EPS accretive Year 2
- Strategic: Addresses #1 priority (cloud security capability)
- Recommendation: ✓ APPROVE
STRATEGIC RATIONALE (4 slides)
- Our strategic priorities → How this deal addresses them
- Why this target (vs. build or alternatives)
- Why now (market timing, competitive dynamics)
- Post-deal competitive positioning (#3 → #1 player)
TARGET OVERVIEW (3 slides)
- Company profile: $140M revenue, 85% SaaS, 650 enterprise customers
- Financial performance: 28% growth, 27% EBITDA margin, 95% NRR
- Strengths & weaknesses matrix
MARKET OPPORTUNITY (2 slides)
- TAM: $18B → $42B by 2027 (15% CAGR)
- Tailwinds: Cloud migration, regulatory requirements, consolidation preference
FINANCIAL ANALYSIS (5 slides)
- Valuation: $500M fair value (DCF, comps, precedents)
- Returns: 18.5% IRR base (24% upside, 12% downside)
- Pro forma impact: 27% revenue growth, 390bps EBITDA margin expansion
- Sensitivity: Revenue growth and synergy capture most impactful
- Financing: $240M cash + $300M debt, 2.8x leverage, maintains BBB rating
SYNERGIES & VALUE CREATION (3 slides)
- Synergy summary: $150M PV ($120M cost, $30M revenue)
- Initiative detail: Headcount, procurement, cross-sell, IT, facilities
- Value bridge: $100M NPV after $500M purchase price
INTEGRATION (2 slides)
- 100-day plan: Stabilize → Execute → Scale
- Governance: Steering Committee, dedicated VP Integration + IMO
RISKS (2 slides)
- Key risks: Customer attrition, talent loss, revenue synergy timing
- Downside scenario: Still delivers 12.1% IRR, positive NPV, manageable leverage
RECOMMENDATION (1 slide)
- ✓ APPROVE - strategically aligned, financially attractive, executable
- Next steps: Execute LOI, 60-day exclusivity, return for binding offer approval
APPENDIX (15 slides)
- Detailed financial model, synergy bottoms-up, comps analysis, precedents, management bios, customer analysis, tech stack, competitive landscape, etc.
Key Takeaways
- IC presentation is a story, not just data - connect strategic rationale to financial returns to value creation
- Executive summary is critical - must stand alone as one-page deal overview
- Pre-wiring matters - never present cold, build consensus before formal meeting
- Be balanced - acknowledge risks honestly, show you've thought through mitigations
- Downside must be acceptable - show even pessimistic scenario delivers acceptable returns
- Synergies need detail - source-by-source build-up with ownership and timelines
- Clear recommendation - don't hedge, state what you're asking for and why
- Prepare for Q&A - anticipate 50+ questions, practice responses
- Use appendix - keep main deck concise, use backup for detail
- Visual > text - charts and graphs, not walls of bullets
The IC presentation is your opportunity to secure approval for a transaction you believe creates value. Prepare thoroughly, pre-wire key stakeholders, tell a compelling story with data, acknowledge risks honestly, and make a clear recommendation. A great IC presentation demonstrates strategic thinking, financial rigor, and execution confidence.
Related Resources
- Deal Thesis Overview - Building the complete deal thesis
- Strategic Rationale - Articulating strategic logic
- Business Case Development - Financial justification and ROI
- Value Creation Planning - Synergy identification and capture
- M&A Negotiation Strategies - Getting to agreed terms
© 2026 CorpDev.Ai Unified Process for M&A
Last updated: Thu Oct 30 2025 20:00:00 GMT-0400 (Eastern Daylight Time)