Merger Model & Accretion/Dilution Analysis
A merger model is the financial framework that evaluates how an acquisition impacts the acquirer's earnings per share (EPS). This guide covers how to build robust merger models, analyze accretion/dilution, and evaluate different deal structures and financing scenarios.
What is a Merger Model?
Definition: A merger model is a financial model that combines two companies' financial statements to analyze the impact of an acquisition on the acquirer's pro forma earnings, particularly EPS accretion or dilution.
Core Purpose: Determine whether the transaction is accretive (increases EPS) or dilutive (decreases EPS) to the acquirer's shareholders.
Key Outputs:
- Pro Forma Income Statement - Combined company financials
- Sources & Uses - Deal financing structure
- EPS Impact - Accretion/dilution analysis
- Returns Analysis - IRR and ROIC
- Credit Metrics - Leverage ratios and coverage
While DCF analysis determines what you should pay based on intrinsic value, a merger model tells you what you can pay while maintaining earnings accretion. These are complementary but distinct analyses.
When to Use Merger Models
Use merger models when:
- Evaluating public company acquisitions
- Acquirer's stock is the primary currency
- Board/shareholders care about EPS impact
- Analyzing alternative financing structures
- Negotiating purchase price and terms
- Modeling earnouts or contingent payments
Critical for:
- Public company M&A
- Large strategic acquisitions
- Stock-heavy deal structures
- Transactions requiring shareholder approval
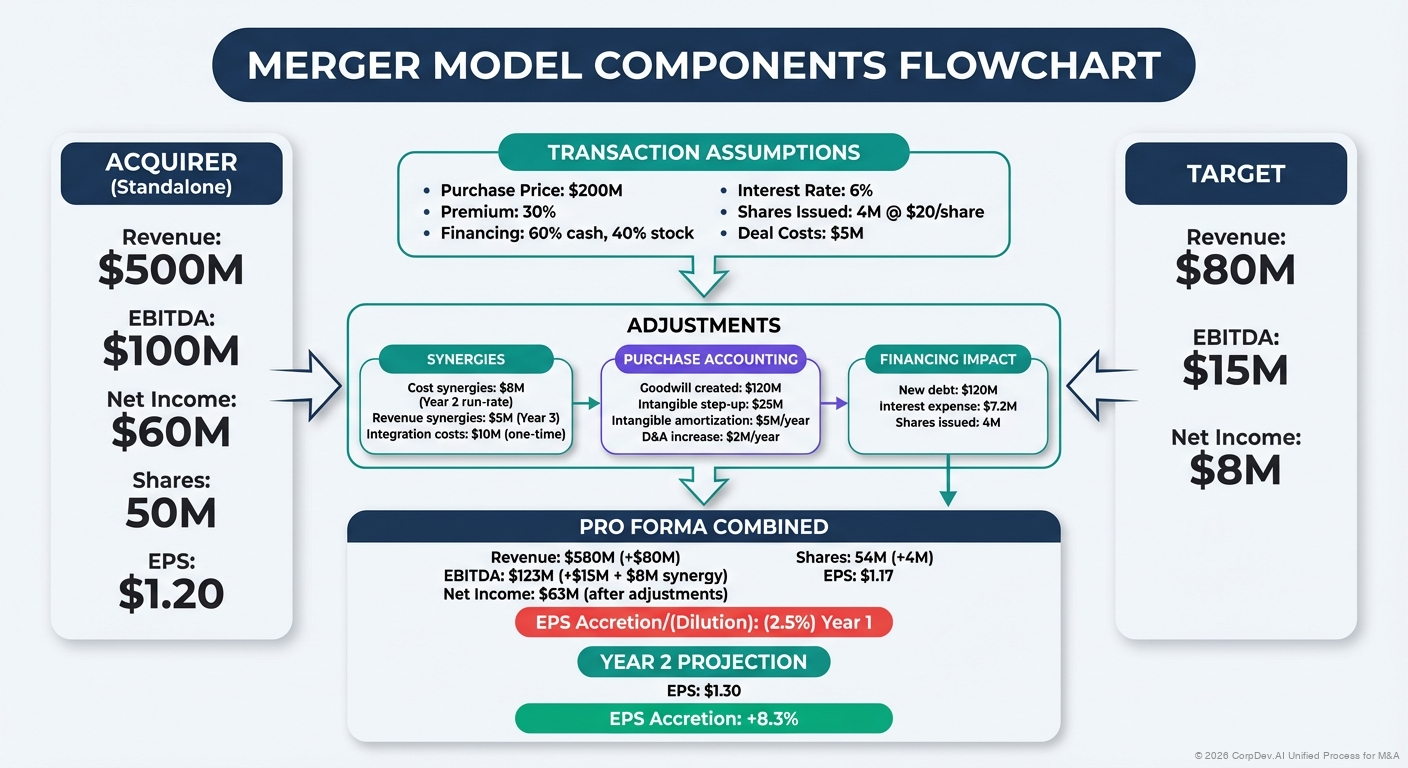
Merger Model Components
1. The Three Core Sections
Sources & Uses
Transaction Financing
How will the deal be funded? Cash, stock, debt, or combination? Includes purchase price allocation and transaction costs.
Pro Forma Financials
Combined Company
Consolidated income statement, balance sheet, and cash flow statement reflecting the combined entity with purchase accounting adjustments.
Accretion/Dilution
EPS Impact Analysis
Calculate standalone vs. pro forma EPS to determine if the deal is accretive (increases EPS) or dilutive (decreases EPS).
2. Key Assumptions
Every merger model requires:
Transaction Assumptions:
- Purchase price and structure
- Form of consideration (cash, stock, mix)
- Transaction and financing costs
- Expected closing date
- Purchase price allocation
Operating Assumptions:
- Standalone financial projections for both companies
- Revenue synergies (if any)
- Cost synergies and timing
- Integration costs
- Tax rate and structure
Financing Assumptions:
- Debt capacity and terms
- Interest rates and amortization
- Stock price for acquirer
- Exchange ratio (if stock deal)
- New share issuance
Step-by-Step Merger Model Construction
Step 1: Gather Financial Information
For Acquirer:
- Historical financial statements (3-5 years)
- Current share count and treasury stock method details
- Current stock price and trading multiples
- Existing debt schedule and terms
- Current credit metrics and rating
- Standalone financial projections
For Target:
- Historical financial statements
- Quality of earnings (QofE) analysis
- Management projections
- Current capital structure
- Working capital requirements
- Tax attributes (NOLs, basis, etc.)
Example Data Gathering:
ACQUIRER (BuyerCo)
Current Stock Price:           $45.00
Shares Outstanding:            100M shares
Market Cap:                    $4,500M
Current Year EPS:              $3.00
Next Year Est. EPS:            $3.30
Existing Debt:                 $500M

TARGET (TargetCo)
Purchase Price:                $1,500M
Current Revenue:               $400M
Current EBITDA:                $80M
Current Net Income:            $45M
Existing Debt:                 $100M
Existing Cash:                 $50M
Step 2: Build Sources & Uses Table
The Sources & Uses table shows how the transaction is financed.
Uses of Funds (What You're Paying For):
Purchase Equity Value
+ Refinance Target Debt
+ Transaction Fees
+ Financing Fees
= Total Uses
Sources of Funds (How You're Paying):
New Debt
+ Acquirer Stock Issued
+ Cash from Balance Sheet
= Total Sources
Must Balance: Total Sources = Total Uses
Complete Example:
| USES OF FUNDS | $ Millions | % |
|---|---|---|
| Purchase Equity Value | $1,500 | 92.0% |
| Refinance Target Debt | $100 | 6.1% |
| Transaction Fees (2%) | $30 | 1.8% |
| TOTAL USES | $1,630 | 100.0% |
| SOURCES OF FUNDS | $ Millions | % |
|---|---|---|
| New Term Loan | $600 | 36.8% |
| Acquirer Stock (@ $45.00) | $900 | 55.2% |
| Cash from Balance Sheet | $130 | 8.0% |
| TOTAL SOURCES | $1,630 | 100.0% |
Key Calculations:
Enterprise Value = Equity Value + Debt - Cash
                = $1,500M + $100M - $50M
                = $1,550M

Implied Multiples:
EV / Revenue = $1,550M / $400M = 3.9x
EV / EBITDA = $1,550M / $80M = 19.4x

New Shares Issued = Stock Consideration / Stock Price
                  = $900M / $45.00 = 20.0M shares

Pro Forma Shares = Acquirer Shares + New Shares
                 = 100M + 20M = 120M shares
Step 3: Purchase Price Allocation (PPA)
Purchase price allocation determines how the purchase price is allocated on the balance sheet.
Purchase Price Allocation Formula:
Purchase Price
- Fair Value of Net Assets Acquired
= Goodwill
Key Steps:
- Identify Acquired Assets and Liabilities
- Fair Value Adjustments - Revalue to fair market value
- Identify Intangible Assets - Customer relationships, technology, brand
- Calculate Goodwill - Residual amount
Example Purchase Price Allocation:
Purchase Price:                              $1,500M

NET ASSETS ACQUIRED:
Current Assets                               $150M
PP&E (at fair value)                         $200M
Identified Intangibles:
  - Customer Relationships (10yr)            $250M
  - Technology/IP (5yr)                      $150M
  - Trade Names (indefinite)                 $50M
Current Liabilities                          ($100M)
Deferred Tax Liability (25% on intangibles) ($112M)
─────────────────────────────────────────────
Fair Value of Net Assets                     $588M

GOODWILL = $1,500M - $588M = $912M
Tax Impact: Intangibles create deferred tax liability because book basis ≠ tax basis (often not tax deductible)
Step 4: Build Pro Forma Income Statement
Combine both companies' income statements with adjustments.
Pro Forma Adjustments:
- Revenue - Standalone projections + synergies (if applicable)
- Cost Synergies - Cost savings from integration
- D&A - New depreciation/amortization from PPA
- Interest Expense - New debt service
- Share Count - Include new shares issued
Complete Pro Forma Example:
| Pro Forma Income Statement (Year 1) | BuyerCo | TargetCo | Adjustments | Pro Forma |
|---|---|---|---|---|
| Revenue | $2,000 | $400 | — | $2,400 |
| Cost of Revenue | (800) | (200) | — | (1,000) |
| Gross Profit | 1,200 | 200 | — | 1,400 |
| Operating Expenses | (600) | (120) | 30 | (690) |
| Cost Synergies | — | — | +$30M | — |
| D&A | (100) | (20) | (50) | (170) |
| PPA Intangible Amort. | — | — | -$50M | — |
| EBIT | 500 | 60 | (20) | 540 |
| Interest Expense | (25) | (5) | (30) | (60) |
| New Debt Interest @ 5% | — | — | -$30M | — |
| Pre-Tax Income | 475 | 55 | (50) | 480 |
| Taxes @ 25% | (119) | (14) | 13 | (120) |
| Net Income | $356 | $41 | ($37) | $360 |
Key Adjustments Explained:
- Cost Synergies (+$30M): Elimination of redundant roles, facilities, systems
- PPA Amortization (-$50M): New intangible assets amortization
Customer Relationships: $250M / 10 years = $25M/year Technology: $150M / 5 years = $30M/year Total Annual Amortization = $55M (rounded to $50M shown) - New Interest Expense (-$30M): $600M debt × 5.0% = $30M/year
- Tax Benefit (+$13M): Tax shield on incremental interest expense
Step 5: Calculate Accretion/Dilution
The Critical Question: Does the deal increase or decrease EPS?
EPS Calculation:
EPS = Net Income / Weighted Average Shares Outstanding
Accretion/Dilution Formula:
Accretion/(Dilution) % = (Pro Forma EPS - Standalone EPS) / Standalone EPS
Complete Accretion/Dilution Analysis:
| Metric | BuyerCo Standalone | Pro Forma Combined | Change |
|---|---|---|---|
| Net Income ($M) | $356 | $360 | +$4 |
| Shares Outstanding (M) | 100.0 | 120.0 | +20.0 |
| EPS | $3.56 | $3.00 | ($0.56) |
| Accretion/(Dilution) | — | — | (15.7%) |
Interpretation:
Accretion/Dilution = ($3.00 - $3.56) / $3.56 = -15.7%

Result: The deal is 15.7% DILUTIVE in Year 1
A dilutive deal can still create shareholder value if:
• The acquisition becomes accretive in future years
• Strategic value justifies near-term dilution
• Synergies create long-term value exceeding dilution
• Target's growth rate exceeds acquirer's growth rate
Step 6: Multi-Year Accretion/Dilution
Show how accretion/dilution evolves over time as synergies ramp and financing costs are paid down.
Multi-Year Analysis:
| Metric ($M except EPS) | Year 1 | Year 2 | Year 3 |
|---|---|---|---|
| STANDALONE BUYERCO | |||
| Net Income | $356 | $392 | $431 |
| Shares Outstanding | 100.0 | 100.0 | 100.0 |
| Standalone EPS | $3.56 | $3.92 | $4.31 |
| PRO FORMA COMBINED | |||
| Pro Forma Net Income | $360 | $450 | $540 |
| Pro Forma Shares | 120.0 | 120.0 | 120.0 |
| Pro Forma EPS | $3.00 | $3.75 | $4.50 |
| ACCRETION/(DILUTION) ANALYSIS | |||
| EPS Difference | ($0.56) | ($0.17) | $0.19 |
| Accretion/(Dilution) % | (15.7%) | (4.3%) | +4.4% |
Key Insights:
- Year 1: 15.7% dilutive due to high amortization and interest costs
- Year 2: 4.3% dilutive as synergies ramp up
- Year 3: 4.4% accretive as full synergies realized and growth accelerates
Synergy Ramp Assumption:
Year 1: 50% of run-rate synergies ($30M × 50% = $15M realized)
Year 2: 100% of run-rate synergies ($30M fully realized)
Year 3: Full synergies + faster growth from integration
Step 7: Alternative Deal Structures
Model multiple financing scenarios to understand trade-offs.
Scenario Comparison:
| Scenario | All Cash | 50/50 Mix | All Stock |
|---|---|---|---|
| SOURCES ($M) | |||
| Debt | $1,200 | $600 | $0 |
| Stock | $0 | $900 | $1,500 |
| Cash | $430 | $130 | $130 |
| NEW SHARES ISSUED | |||
| New Shares (M) | 0.0 | 20.0 | 33.3 |
| Pro Forma Shares (M) | 100.0 | 120.0 | 133.3 |
| YEAR 1 EPS IMPACT | |||
| Pro Forma Net Income | $307 | $360 | $397 |
| Pro Forma EPS | $3.07 | $3.00 | $2.98 |
| Accretion/(Dilution) | (13.8%) | (15.7%) | (16.3%) |
| CREDIT METRICS | |||
| Total Debt / EBITDA | 6.4x | 3.8x | 1.6x |
| Interest Coverage (EBIT/Int) | 7.3x | 9.0x | 21.6x |
Trade-offs Analysis:
All Cash/Debt:
- ✓ No dilution from new shares
- ✓ Existing shareholders maintain ownership %
- ✗ Highest interest expense drag
- ✗ Leveraged balance sheet
- ✗ Credit rating risk
50/50 Mix (Base Case):
- ✓ Balanced approach
- ✓ Manageable leverage
- ✓ Moderate dilution
- ✗ Some share dilution
- ✗ Some interest expense
All Stock:
- ✓ No debt, pristine balance sheet
- ✓ Preserves financial flexibility
- ✓ Highest net income (no interest)
- ✗ Significant dilution (33% more shares)
- ✗ Ownership dilution for existing shareholders
- ✗ Deal value fluctuates with stock price
Advanced Merger Model Considerations
Treasury Stock Method for Options/RSUs
When calculating pro forma shares, include dilutive securities.
Treasury Stock Method:
Diluted Shares = Options Outstanding - (Options × Strike Price) / Current Price

Example:
10M options outstanding @ $30 strike
Current stock price: $45

Diluted Shares = 10M - (10M × $30) / $45
               = 10M - 6.7M
               = 3.3M additional shares
Convertible Debt Treatment
If-Converted Method:
- Add back interest expense (after-tax)
- Add converted shares to denominator
Example:
$100M convertible debt @ 3% interest, converts to 2M shares

Add back to numerator: $100M × 3% × (1 - 25% tax) = $2.25M
Add to denominator: 2M shares
Purchase Price True-Up
Model potential purchase price adjustments:
Working Capital Adjustment:
Target Working Capital:        $50M
Actual at Close:              $47M
Purchase Price Reduction:      $3M
Earnout Modeling:
Base Purchase Price:           $1,500M
Earnout (Year 2):             $100M if EBITDA > $90M
Probability-Weighted:         $100M × 70% = $70M

Model as contingent liability, expense over earnout period
Synergy Modeling Deep Dive
Cost Synergies (More certain, faster to realize):
Headcount Reduction
Redundant roles: 150 positions
Avg. fully-loaded cost: $150K
Annual savings: 150 × $150K = $22.5M

Severance cost: 150 × $100K = $15M (one-time)
Facility Consolidation
Duplicate offices: 3 locations
Annual rent savings: $5M
One-time exit costs: $8M
Technology/Vendor Consolidation
Duplicate SaaS subscriptions: $2M/year
Professional services savings: $1M/year
Revenue Synergies (Less certain, slower to realize):
Cross-Selling
Target customer base: 5,000 customers
Cross-sell rate: 15%
Avg. deal size: $50K

Year 1 Revenue: 5,000 × 15% × $50K × 50% (ramp) = $18.8M
Year 2 Revenue: 5,000 × 15% × $50K = $37.5M
Product Bundling
Price increase from bundle: 10%
Affected revenue: $200M
Incremental revenue: $20M/year
Synergy Capture Rate:
              Year 1    Year 2    Year 3
Cost Synergies  50%      100%      100%
Revenue Syn.    20%       50%       80%
Balance Sheet Modeling
Don't forget the pro forma balance sheet!
Key Line Items:
Assets:
- Cash (post-transaction)
- Working capital (combined)
- PP&E (fair value adjustments)
- Intangible assets (PPA)
- Goodwill
Liabilities:
- New debt balances
- Deferred tax liabilities (from PPA)
- Assumed liabilities
Equity:
- Common stock (par value of new shares)
- APIC (additional paid-in capital)
- Retained earnings
Example Balance Sheet Impact:
                          Pre-Deal    Post-Deal    Change
Total Assets              $5,000M     $7,100M     +$2,100M
Total Debt               $500M       $1,200M      +$700M
Shareholders' Equity      $4,000M     $5,300M     +$1,300M

Debt/Equity Ratio         12.5%       22.6%       +10.1 pts
Sensitivity Analysis & Scenario Modeling
Model multiple scenarios to understand deal dynamics.

Price Sensitivity
Purchase Price vs. Accretion:
| Purchase Price | $1,300M | $1,400M | $1,500M | $1,600M |
|---|---|---|---|---|
| EV / EBITDA | 16.9x | 18.1x | 19.4x | 20.6x |
| Y1 Accretion | -10.2% | -13.1% | -15.7% | -18.5% |
| Y3 Accretion | +9.1% | +6.5% | +4.4% | +1.8% |
Synergy Sensitivity
Synergies vs. Accretion (Year 3):
                     Cost Synergies Realized
                     $20M    $30M    $40M
Stock Price
$40                  -2.1%   +4.4%   +10.9%
$45                  -5.3%   +1.2%   +7.7%
$50                  -8.1%   -1.8%   +4.7%
Break-Even Analysis
What purchase price makes deal accretion-neutral?
Target Year 1 EPS: $3.56 (standalone)
Pro Forma Shares: 120M
Required Net Income: $3.56 × 120M = $427M

Working backwards:
Required EBITDA: $600M
Less: Target EBITDA: $80M
Implied Max Purchase EBITDA Multiple: ~17.5x
Max Purchase Price: ~$1,400M
Common Merger Model Pitfalls
1. Ignoring Transaction Costs
Problem: Forgetting fees and expenses that reduce net income or increase purchase price
Transaction Costs Include:
- Investment banker fees (1-3% of deal value)
- Legal and accounting fees ($5M-$20M)
- Due diligence costs ($2M-$5M)
- Financing fees (1-2% of debt raised)
- Consent and control change fees
Solution:
- Model all transaction costs explicitly
- Determine if costs are capitalized (added to goodwill) or expensed (reduce NI)
- Most M&A advisory fees are expensed in period incurred
Example Impact:
$1,500M deal
Transaction fees @ 2%: $30M
After-tax impact: $30M × (1 - 25%) = $22.5M hit to Year 1 NI
EPS impact: $22.5M / 120M shares = $0.19/share
2. Incorrect Share Count Calculation
Problem: Using wrong share count or forgetting dilutive securities
Common Mistakes:
- Using basic shares instead of diluted
- Forgetting to add new shares from stock consideration
- Not accounting for treasury stock method on options
- Using wrong weighted average for partial year transactions
Solution:
Pro Forma Shares =
  Acquirer Diluted Shares
  + New Shares Issued for Purchase
  + Shares from Assumed Target Options (treasury method)
  - Buyback from Cash Proceeds (if applicable)
Partial Year Example:
Deal closes June 30 (mid-year)

Standalone shares: 100M (full year)
New shares: 20M (half year)

Weighted Avg = 100M + (20M × 0.5) = 110M shares
3. Double-Counting or Missing Synergies
Problem: Including synergies incorrectly or missing negative synergies
Common Issues:
- Counting same synergy in multiple categories
- Ignoring costs to achieve synergies
- Forgetting revenue dis-synergies (customer losses)
- Over-estimating timing of realization
Solution:
- Build detailed synergy bridge
- Include integration costs and timeline
- Model negative synergies (customer churn, employee departures)
- Use conservative realization assumptions (50%/100% over 2 years)
Example Synergy Bridge:
Gross Cost Synergies Identified:        $40M
- Integration costs (Year 1):           ($15M)
- Realization rate (80%):               × 80%
Net Cost Synergies:                     $17M (run-rate)

Revenue Synergies:                      $25M
- Customer churn:                       ($5M)
- Delayed realization (Year 1):        × 30%
Net Revenue Synergies (Year 1):         $6M
4. Wrong Tax Rate
Problem: Using inappropriate tax rate for pro forma entity
Issues:
- Using statutory rate instead of effective rate
- Not adjusting for non-deductible expenses
- Forgetting NOL utilization
- Ignoring international tax considerations
Solution:
- Use effective tax rate from historical financials
- Adjust for one-time items
- Model NOL usage if applicable
- Consider 163(j) interest deduction limitations
Example:
Statutory rate: 21%
State taxes: 4%
Permanent differences: +1%
Effective tax rate: 26%

NOT 21%!
5. Incorrect PPA Treatment
Problem: Wrong amortization periods or missing deferred tax impact
Common Errors:
- Amortizing goodwill (not allowed under GAAP)
- Using wrong useful lives for intangibles
- Forgetting deferred tax liability on intangibles
- Not adjusting D&A in future years
Solution:
Intangible Asset          Amount    Life    Annual Amort
Customer Relationships    $250M     10yr    $25M
Technology/IP             $150M     5yr     $30M
Trade Names              $50M      Indef    $0
Goodwill                 $912M     Indef    $0

Total PPA Amortization: $55M/year

Deferred Tax Liability = ($250M + $150M) × 25% = $100M
(Reduces net assets acquired, increases goodwill)
6. Forgetting Balance Sheet Impact
Problem: Only modeling P&L, ignoring B/S and credit metrics
Solution:
- Model pro forma balance sheet
- Calculate leverage ratios (Debt/EBITDA)
- Calculate coverage ratios (EBIT/Interest)
- Ensure compliance with debt covenants
- Consider rating agency impact
7. Static Stock Price Assumption
Problem: Not stress-testing impact of stock price changes on deal value
For Stock Deals:
- Deal value fluctuates with stock price
- Fixed exchange ratio vs. fixed value collar
- Impact on accretion/dilution
Solution: Model multiple stock price scenarios
Example:
Fixed exchange ratio: 0.5 shares per target share
Target shares: 30M
Fixed shares issued: 15M

Acquirer Stock Price    Deal Value         Impact
$40                     $600M              Underpay
$45                     $675M              Base
$50                     $750M              Overpay

Consider collar: 0.45 - 0.55 ratio based on $40-$50 range
Best Practices
1. Build a Flexible Model
Model Architecture:
- Separate assumptions tab (all inputs in one place)
- Scenario dropdowns for different cases
- Data validation and error checks
- Clear color coding (blue = input, black = formula)
Key Toggles:
Purchase Price:         $1,500M
Stock/Cash Mix:         60% / 40%
Synergy Realization:    50% / 100% (Y1/Y2)
Closing Date:           Q2 2025
Tax Rate:              25%
2. Multiple Scenarios and Sensitivities
Build Three Core Cases:
- Base Case: Most likely scenario
- Upside Case: Optimistic but achievable
- Downside Case: Conservative scenario
Key Sensitivities:
- Purchase price (±10-20%)
- Stock price (±20%)
- Synergies (50%-150% of plan)
- Growth rates
- Financing costs
3. Link to Strategic Rationale
Beyond the Numbers:
- Why does deal make strategic sense?
- How does valuation compare to standalone DCF?
- What's the walk from DCF value to offer price?
- What are the key value creation drivers?
Strategic Value Bridge:
DCF Standalone Value:              $1,200M
+ Control Premium (20%):           $240M
+ PV of Cost Synergies:           $180M
+ PV of Revenue Synergies:        $120M
+ Strategic/Platform Value:        $100M
─────────────────────────────────
Justifiable Price:                 $1,840M
Actual Offer:                      $1,500M
Margin of Safety:                  $340M (23%)
4. Credit and Leverage Analysis
Key Metrics to Track:
| Metric | Investment Grade Target | High Yield Target |
|---|---|---|
| Debt / EBITDA | < 3.0x | < 5.0x |
| EBIT / Interest | >> 5.0x | >> 3.0x |
| Debt / Total Cap | < 40% | < 60% |
| FCF / Debt | > 20% | > 10% |
5. Football Field Valuation Summary
Present merger model results alongside other valuation methods:
Valuation Method                 Low      Mid      High
─────────────────────────────────────────────────────
DCF Analysis                    $1,200   $1,350   $1,500
Comparable Companies            $1,150   $1,300   $1,450
Precedent Transactions          $1,300   $1,450   $1,600
─────────────────────────────────────────────────────
Implied Range                   $1,150   $1,367   $1,517

Management Target              $1,500
Control Premium                 15.8%
6. Returns Analysis
Calculate returns metrics beyond accretion/dilution:
Internal Rate of Return (IRR):
Year 0: Purchase Price         ($1,500M)
Year 1-5: Annual FCF           $100M - $180M
Year 5: Exit Value             $2,100M (14x EBITDA)

IRR = 18.5%
Return on Invested Capital (ROIC):
ROIC = NOPAT / Invested Capital

Year 3 ROIC:
NOPAT: $85M
Invested Capital: $1,500M

ROIC = $85M / $1,500M = 5.7%

Target: Exceed WACC (typically 8-12%)
7. Risk-Adjusted Analysis
Probability-Weight Scenarios:
                    Prob    EPS     Weighted
Base Case           50%     $3.00   $1.50
Upside              25%     $3.75   $0.94
Downside            25%     $2.40   $0.60
─────────────────────────────────────────
Expected EPS                        $3.04

Standalone EPS:                     $3.56
Expected Dilution:                  -14.6%
8. Board Presentation Framework
Key Slides for Board:
- Transaction Overview - Price, structure, rationale
- Strategic Fit - Why this deal, why now
- Valuation Summary - Football field
- Sources & Uses - Deal financing
- Financial Impact - Accretion/dilution
- Sensitivities - Key risk factors
- Synergy Bridge - Cost and revenue synergies
- Integration Plan - Timeline and risks
- Alternatives - Why not other targets
- Recommendation - Go/no-go with clear logic
Real-World Merger Model Example
Case Study: TechAcquirer buys CloudTarget
Deal Parameters
TechAcquirer (Buyer):
Current Stock Price:           $85.00
Shares Outstanding:            500M
Market Cap:                    $42.5B
LTM Revenue:                   $10.0B
LTM EBITDA:                    $2.5B
LTM Net Income:                $1.5B
Current EPS:                   $3.00
P/E Ratio:                     28.3x

CloudTarget (Target):
Purchase Price:                $5.0B
LTM Revenue:                   $800M
LTM EBITDA:                    $160M
LTM Net Income:                $85M
Existing Debt:                 $200M
Cash:                          $100M
Deal Structure
| Sources & Uses | $ Millions |
|---|---|
| USES | |
| Purchase Equity Value | $5,000 |
| Refinance Target Debt | $200 |
| Transaction Fees (2%) | $100 |
| Total Uses | $5,300 |
| SOURCES | |
| Stock (70% @ $85.00) | $3,710 |
| New Term Loan (30%) | $1,590 |
| Total Sources | $5,300 |
New Shares Issued: $3,710M / $85.00 = 43.6M shares
Pro Forma Shares: 500M + 43.6M = 543.6M shares
Accretion/Dilution Analysis
Year 1 Pro Forma:
TechAcquirer Standalone NI:        $1,500M
CloudTarget NI:                    $85M
Combined Pre-Synergies:            $1,585M

Adjustments:
- PPA Amortization ($800M/8yr)     ($100M)
- New Interest @ 5.0%              ($80M)
+ Cost Synergies (50% realized)    $60M
- Transaction Costs                ($75M)
+ Tax Benefit @ 25%                $49M
═══════════════════════════════════════
Pro Forma Net Income:              $1,439M

Pro Forma EPS = $1,439M / 543.6M = $2.65

Standalone EPS:                    $3.00
Pro Forma EPS:                     $2.65
Accretion/(Dilution):              -11.7% DILUTIVE
Year 3 Pro Forma (Full Synergies):
Pro Forma Net Income:              $1,950M
Pro Forma Shares:                  543.6M
Pro Forma EPS:                     $3.59

Standalone EPS (projected):        $3.50
Accretion:                         +2.6% ACCRETIVE
Conclusion: Deal is dilutive in Year 1 but becomes accretive by Year 3 as synergies fully realize.
Full Merger Model Template
This section provides a complete, production-ready merger model template that can be used as-is for mid-market and large company M&A transactions. Copy this template into Excel and customize the inputs for your specific deal.
SECTION 1: Transaction Assumptions & Inputs
Use this section for all deal-specific inputs. Keep all assumptions in one place for easy scenario analysis.
═══════════════════════════════════════════════════════════════
                    MERGER MODEL INPUTS
═══════════════════════════════════════════════════════════════

TRANSACTION OVERVIEW
───────────────────────────────────────────────────────────────
Deal Announcement Date:                    [MM/DD/YYYY]
Expected Close Date:                       [MM/DD/YYYY]
Transaction Structure:                     [Stock/Cash/Mixed]
Target Company Name:                       [TargetCo]
Acquirer Company Name:                     [AcquirerCo]

PURCHASE PRICE & CONSIDERATION
───────────────────────────────────────────────────────────────
Purchase Equity Value ($M):                $1,500
Premium to Current Price:                  25.0%
Premium to 30-Day VWAP:                    22.5%

Form of Consideration:
  % Cash:                                  40.0%
  % Stock:                                 60.0%
  Total:                                   100.0%

Cash Consideration ($M):                   $600
Stock Consideration ($M):                  $900

IMPLIED VALUATION MULTIPLES
───────────────────────────────────────────────────────────────
Target LTM Revenue ($M):                   $400
Target LTM EBITDA ($M):                    $80
Target LTM EBIT ($M):                      $60
Target Net Debt ($M):                      $50
  (Debt $100M - Cash $50M)

Enterprise Value ($M):                     $1,550
  (Equity Value $1,500 + Net Debt $50)

EV / LTM Revenue:                          3.9x
EV / LTM EBITDA:                           19.4x
EV / LTM EBIT:                             25.8x
P / LTM Net Income ($45M):                 33.3x

ACQUIRER INFORMATION
───────────────────────────────────────────────────────────────
Current Stock Price:                       $45.00
Shares Outstanding - Basic (M):            100.0
Treasury Stock Options (M):                5.0
Diluted Shares Outstanding (M):            103.0

Market Capitalization ($M):                $4,500
Current Year Est. EPS:                     $3.00
Next Year Est. EPS:                        $3.30
Current P/E Ratio:                         15.0x

Existing Total Debt ($M):                  $500
Existing Cash ($M):                        $300
Net Debt ($M):                             $200

TARGET INFORMATION
───────────────────────────────────────────────────────────────
Target Shares Outstanding (M):             30.0
Implied Price per Share:                   $50.00
Pre-Announcement Price:                    $40.00

Target Existing Debt ($M):                 $100
Target Cash ($M):                          $50
Target Net Debt ($M):                      $50

FINANCING ASSUMPTIONS
───────────────────────────────────────────────────────────────
New Debt Issuance ($M):                    $600
  Revolver Draw ($M):                      $0
  Term Loan A ($M):                        $400
  Term Loan B ($M):                        $200
  Senior Notes ($M):                       $0

Weighted Average Cost of Debt:            5.00%
  Revolver Rate:                           4.50%
  Term Loan A Rate:                        4.75%
  Term Loan B Rate:                        5.50%
  Senior Notes Rate:                       5.25%

Target Debt to Refinance ($M):            $100
Cash from Balance Sheet ($M):             $130

New Stock Issuance:
  Dollar Amount ($M):                      $900
  Stock Price for Issuance:                $45.00
  New Shares Issued (M):                   20.0
  Pro Forma Shares Outstanding (M):        123.0

TRANSACTION COSTS & FEES
───────────────────────────────────────────────────────────────
M&A Advisory Fees (% of Equity Value):     2.0%
M&A Advisory Fees ($M):                    $30.0

Legal & Accounting ($M):                   $15.0
Due Diligence Costs ($M):                  $3.0
Financing Fees (% of Debt):                1.5%
Financing Fees ($M):                       $9.0
Other Transaction Costs ($M):              $3.0

Total Transaction Costs ($M):              $60.0

Treatment of Transaction Costs:
  Expensed in Current Period:              $48.0
  Capitalized (Debt Fees):                 $9.0
  Seller-Paid Fees:                        $3.0

TAX ASSUMPTIONS
───────────────────────────────────────────────────────────────
Acquirer Effective Tax Rate:               25.0%
Target Effective Tax Rate:                 25.0%
Pro Forma Tax Rate:                        25.0%
Tax Structure:                             [Taxable/Tax-Free]

Target NOLs ($M):                          $0
Annual NOL Limitation (§382):              $0

SYNERGY ASSUMPTIONS
───────────────────────────────────────────────────────────────
COST SYNERGIES (Run-Rate):

Headcount Reduction:
  Positions Eliminated:                    150
  Avg. Fully-Loaded Cost ($K):             $150
  Annual Savings ($M):                     $22.5

Facility Consolidation ($M):               $5.0
Vendor/Technology Consolidation ($M):      $3.0
Other Operating Expense Savings ($M):      $2.5

Total Run-Rate Cost Synergies ($M):        $33.0

Cost Synergy Realization:
  Year 1 (% of run-rate):                  50%
  Year 2 (% of run-rate):                  100%
  Year 3+ (% of run-rate):                 100%

One-Time Costs to Achieve:
  Severance ($M):                          $15.0
  Facility Exit Costs ($M):                $8.0
  System Integration ($M):                 $12.0
  Other Integration Costs ($M):            $5.0
  Total Integration Costs ($M):            $40.0

Integration Cost Timing:
  Year 1:                                  75%
  Year 2:                                  25%

REVENUE SYNERGIES (Run-Rate):

Cross-Selling Revenue ($M):                $15.0
Product Bundling Uplift ($M):              $8.0
Market Expansion ($M):                     $5.0

Total Run-Rate Revenue Synergies ($M):     $28.0

Revenue Synergy Realization:
  Year 1 (% of run-rate):                  20%
  Year 2 (% of run-rate):                  50%
  Year 3 (% of run-rate):                  80%
  Year 4+ (% of run-rate):                 100%

Incremental Margin on Revenue Synergies:   60%

DIS-SYNERGIES:

Customer Churn ($M):                       $10.0
Key Employee Departures Impact ($M):       $5.0
Total Dis-Synergies ($M):                  $15.0

WACC / DISCOUNT RATE ASSUMPTIONS
───────────────────────────────────────────────────────────────
Risk-Free Rate (10Y Treasury):             4.0%
Beta (Levered):                            1.2
Market Risk Premium:                       5.5%
Size Premium:                              2.0%

Cost of Equity:                            12.6%
  = Rf + (Beta × MRP) + Size Premium
  = 4.0% + (1.2 × 5.5%) + 2.0%

After-Tax Cost of Debt:                    3.75%
  = 5.0% × (1 - 25%)

Target Capital Structure:
  Debt / (Debt + Equity):                  20%
  Equity / (Debt + Equity):                80%

WACC:                                      11.1%
  = (80% × 12.6%) + (20% × 3.75%)
SECTION 2: Sources & Uses of Funds
═══════════════════════════════════════════════════════════════
                      SOURCES & USES
═══════════════════════════════════════════════════════════════

USES OF FUNDS                              $M        % of Total
───────────────────────────────────────────────────────────────
Purchase Target Equity                     $1,500    92.0%
Repay/Refinance Target Debt               $100      6.1%
Transaction Fees & Expenses               $30       1.8%
Financing Fees                            $0        0.0%
                                          ─────────────────────
TOTAL USES                                $1,630    100.0%

SOURCES OF FUNDS                           $M        % of Total
───────────────────────────────────────────────────────────────
New Term Loan                             $600      36.8%
Acquirer Stock Issued                     $900      55.2%
Cash from Balance Sheet                   $130      8.0%
Revolver Draw                             $0        0.0%
                                          ─────────────────────
TOTAL SOURCES                             $1,630    100.0%

Check (must = $0):                        $0        ✓

TRANSACTION SUMMARY METRICS
───────────────────────────────────────────────────────────────
Total Transaction Value ($M):              $1,630
Enterprise Value ($M):                     $1,550
Equity Value ($M):                         $1,500
Net Debt Assumed ($M):                     $50

Purchase Price per Target Share:          $50.00
Target Shares Acquired (M):                30.0

Premium Paid:
  vs. Unaffected Price ($40):              25.0%
  vs. 30-Day VWAP ($41):                   22.0%
  vs. 52-Week High ($48):                  4.2%

New Acquirer Shares Issued (M):            20.0
Exchange Ratio (per target share):         0.667x
Fixed Collar Range:                        $42 - $48

Pro Forma Ownership:
  Existing Acquirer Shareholders:          83.7%
  Former Target Shareholders:              16.3%
SECTION 3: Purchase Price Allocation (PPA)
═══════════════════════════════════════════════════════════════
              PURCHASE PRICE ALLOCATION (PPA)
═══════════════════════════════════════════════════════════════

PURCHASE PRICE                                        $M
───────────────────────────────────────────────────────────────
Total Consideration Paid                              $1,500

LESS: FAIR VALUE OF NET ASSETS ACQUIRED
───────────────────────────────────────────────────────────────

ASSETS:
Current Assets:
  Cash & Equivalents                    $50
  Accounts Receivable                   $60
  Inventory                             $30
  Other Current Assets                  $10
  Total Current Assets                                $150

Fixed Assets (PP&E):
  Book Value                            $150
  Fair Value Step-Up                    $50
  Fair Value of PP&E                                  $200

Identified Intangible Assets:
  Customer Relationships
    Fair Value                          $250
    Useful Life (years)                 10
    Annual Amortization                 $25

  Developed Technology/IP
    Fair Value                          $150
    Useful Life (years)                 5
    Annual Amortization                 $30

  Trade Names & Trademarks
    Fair Value                          $50
    Useful Life                         Indefinite
    Annual Amortization                 $0

  Non-Compete Agreements
    Fair Value                          $20
    Useful Life (years)                 3
    Annual Amortization                 $7

  Total Identified Intangibles                        $470
  Total Annual Amortization                           $62

Other Assets                                          $10

TOTAL ASSETS ACQUIRED                                 $830

LIABILITIES:
Current Liabilities:
  Accounts Payable                      $50
  Accrued Expenses                      $30
  Deferred Revenue                      $20
  Total Current Liabilities                           ($100)

Long-Term Liabilities:
  Deferred Tax Liability (on intangibles)
    Tax Rate                            25%
    Taxable Intangibles                 $470
    DTL Created                                       ($118)

  Other Long-Term Liabilities                         ($10)

TOTAL LIABILITIES ASSUMED                             ($228)

NET ASSETS ACQUIRED (Fair Value)                      $602

GOODWILL CALCULATION
───────────────────────────────────────────────────────────────
Purchase Price                                        $1,500
Less: Fair Value of Net Assets                        ($602)
                                                      ──────
GOODWILL                                              $898

Goodwill as % of Purchase Price:                      59.9%

ANNUAL AMORTIZATION EXPENSE SCHEDULE
───────────────────────────────────────────────────────────────
                            Y1    Y2    Y3    Y4    Y5    Total
Customer Relationships      $25   $25   $25   $25   $25   $125
Technology/IP              $30   $30   $30   $30   $30   $150
Trade Names                $0    $0    $0    $0    $0    $0
Non-Compete                $7    $7    $7    $0    $0    $20
                          ─────────────────────────────────────
Total PPA Amortization     $62   $62   $62   $55   $55   $295

Note: Goodwill and indefinite-lived intangibles are not
amortized but subject to annual impairment testing.
SECTION 4: Pro Forma Income Statement (5-Year Projection)
═══════════════════════════════════════════════════════════════════════════════════════
                           PRO FORMA INCOME STATEMENT
═══════════════════════════════════════════════════════════════════════════════════════
($M except per share data)           LTM    Year 1   Year 2   Year 3   Year 4   Year 5
───────────────────────────────────────────────────────────────────────────────────────

ACQUIRER STANDALONE
Revenue                              $2,000  $2,200  $2,420  $2,662  $2,928  $3,221
% Growth                             —       10.0%   10.0%   10.0%   10.0%   10.0%
COGS                                 (800)   (880)   (968)   (1,065) (1,171) (1,288)
Gross Profit                         1,200   1,320   1,452   1,597   1,757   1,933
Gross Margin %                       60.0%   60.0%   60.0%   60.0%   60.0%   60.0%

Operating Expenses                   (600)   (638)   (665)   (692)   (721)   (750)
D&A                                  (100)   (110)   (121)   (133)   (146)   (161)
EBIT                                 500     572     666     772     890     1,022
EBIT Margin %                        25.0%   26.0%   27.5%   29.0%   30.4%   31.7%

Interest Expense                     (25)    (25)    (25)    (24)    (23)    (22)
Pre-Tax Income                       475     547     641     748     867     1,000
Taxes @ 25%                          (119)   (137)   (160)   (187)   (217)   (250)
Net Income                           $356    $410    $481    $561    $650    $750

Diluted Shares (M)                   103.0   103.0   103.0   103.0   103.0   103.0
EPS - Standalone                     $3.46   $3.98   $4.67   $5.45   $6.31   $7.28

───────────────────────────────────────────────────────────────────────────────────────

TARGET STANDALONE
Revenue                              $400    $460    $529    $608    $699    $804
% Growth                             —       15.0%   15.0%   15.0%   15.0%   15.0%
COGS                                 (200)   (230)   (265)   (304)   (350)   (402)
Gross Profit                         200     230     264     304     349     402
Gross Margin %                       50.0%   50.0%   50.0%   50.0%   50.0%   50.0%

Operating Expenses                   (120)   (129)   (138)   (146)   (154)   (161)
D&A                                  (20)    (21)    (22)    (23)    (24)    (25)
EBIT                                 60      80      104     135     171     216
EBIT Margin %                        15.0%   17.4%   19.7%   22.2%   24.5%   26.9%

Interest Expense                     (5)     (5)     (5)     (5)     (5)     (5)
Pre-Tax Income                       55      75      99      130     166     211
Taxes @ 25%                          (14)    (19)    (25)    (33)    (42)    (53)
Net Income                           $41     $56     $74     $98     $125    $158

───────────────────────────────────────────────────────────────────────────────────────

PRO FORMA ADJUSTMENTS
PPA Amortization                     —       (62)    (62)    (62)    (55)    (55)
New Interest Expense                 —       (30)    (30)    (29)    (28)    (27)
Eliminate Target Interest            —       5       5       5       5       5
Cost Synergies Realized              —       17      33      33      33      33
Revenue Synergies (60% margin)       —       3       8       13      17      17
Dis-Synergies                        —       (15)    (8)     (3)     0       0
Integration Costs                    —       (30)    (10)    0       0       0
Transaction Costs (expensed)         —       (48)    0       0       0       0
Tax Impact of Adjustments @ 25%      —       30      16      11      8       7

Total Pro Forma Adjustments          —       (130)   (48)    (32)    (20)    (20)

───────────────────────────────────────────────────────────────────────────────────────

PRO FORMA COMBINED
Revenue                              $2,400  $2,660  $2,949  $3,270  $3,627  $4,025
% Growth YoY                         —       10.8%   10.9%   10.9%   10.9%   11.0%

Combined Gross Profit                1,400   1,550   1,716   1,901   2,106   2,335
Gross Margin %                       58.3%   58.3%   58.2%   58.1%   58.1%   58.0%

Combined Operating Expenses          (720)   (750)   (775)   (805)   (842)   (878)
Combined D&A                         (120)   (131)   (143)   (156)   (170)   (186)
PPA Amortization                     —       (62)    (62)    (62)    (55)    (55)
Cost Synergies                       —       17      33      33      33      33
Integration Costs                    —       (30)    (10)    0       0       0

Pro Forma EBIT                       560     594     759     911     1,072   1,249
EBIT Margin %                        23.3%   22.3%   25.7%   27.9%   29.6%   31.0%

Pro Forma Interest Expense           (30)    (50)    (50)    (48)    (46)    (44)
Pro Forma Pre-Tax Income             530     544     709     863     1,026   1,205
Pro Forma Taxes @ 25%                (133)   (136)   (177)   (216)   (257)   (301)

PRO FORMA NET INCOME                 $397    $408    $532    $647    $770    $904

Pro Forma Diluted Shares (M)         123.0   123.0   123.0   123.0   123.0   123.0

PRO FORMA EPS                        $3.23   $3.32   $4.33   $5.26   $6.26   $7.35

───────────────────────────────────────────────────────────────────────────────────────

ACCRETION / (DILUTION) ANALYSIS
Standalone EPS                       $3.46   $3.98   $4.67   $5.45   $6.31   $7.28
Pro Forma EPS                        $3.23   $3.32   $4.33   $5.26   $6.26   $7.35
Difference                           ($0.23) ($0.66) ($0.34) ($0.19) ($0.05) $0.07

Accretion / (Dilution) %             (6.6%)  (16.6%) (7.3%)  (3.5%)  (0.8%)  1.0%

Status                               DILUTIVE DILUTIVE DILUTIVE DILUTIVE DILUTIVE ACCRETIVE
SECTION 5: Pro Forma Balance Sheet
═══════════════════════════════════════════════════════════════
              PRO FORMA BALANCE SHEET (Post-Close)
═══════════════════════════════════════════════════════════════
($M)                           Acquirer  Target   Adj.    Pro Forma
───────────────────────────────────────────────────────────────

ASSETS
Current Assets:
  Cash & Equivalents           $300      $50      ($170)  $180
  Accounts Receivable          400       60       0       460
  Inventory                    200       30       0       230
  Other Current Assets         100       10       0       110
  Total Current Assets         1,000     150      (170)   980

Fixed Assets (PP&E):
  Gross PP&E                   2,000     150      50      2,200
  Accumulated Depreciation     (800)     0        0       (800)
  Net PP&E                     1,200     150      50      1,400

Intangible Assets:
  Customer Relationships       0         0        250     250
  Technology/IP                0         0        150     150
  Trade Names                  0         0        50      50
  Non-Compete                  0         0        20      20
  Total Intangibles            0         0        470     470

Goodwill                       500       0        898     1,398

Other Assets                   100       10       0       110

TOTAL ASSETS                   $2,800    $310     $1,248  $4,358

───────────────────────────────────────────────────────────────

LIABILITIES
Current Liabilities:
  Accounts Payable             $200      $50      $0      $250
  Accrued Expenses             150       30       0       180
  Short-Term Debt              50        0        0       50
  Deferred Revenue             0         20       0       20
  Total Current Liabilities    400       100      0       500

Long-Term Debt:
  Existing Acquirer Debt       450       0        0       450
  Target Debt (refinanced)     0         100      (100)   0
  New Debt                     0         0        600     600
  Total Long-Term Debt         450       100      500     1,050

Deferred Tax Liability         100       0        118     218

Other Liabilities              50        10       0       60

TOTAL LIABILITIES              $1,000    $210     $518    $1,728

───────────────────────────────────────────────────────────────

SHAREHOLDERS' EQUITY
Common Stock (par)             $10       $3       $2      $12
Additional Paid-In Capital     600       37       898     1,535
Retained Earnings              1,190     60       (170)   1,080
Treasury Stock                 0         0        0       0

TOTAL EQUITY                   $1,800    $100     $730    $2,630

TOTAL LIABILITIES & EQUITY     $2,800    $310     $1,248  $4,358

───────────────────────────────────────────────────────────────

KEY BALANCE SHEET METRICS
Total Debt                                                $1,100
Cash                                                      $180
Net Debt                                                  $920

Book Value of Equity                                      $2,630
Shares Outstanding (M)                                    123.0
Book Value per Share                                      $21.38

Debt / Equity                                             41.8%
Debt / Total Capitalization                               29.5%
SECTION 6: Credit Metrics & Leverage Analysis
═══════════════════════════════════════════════════════════════
                    CREDIT METRICS ANALYSIS
═══════════════════════════════════════════════════════════════
                                Year 1   Year 2   Year 3   Year 4   Year 5
───────────────────────────────────────────────────────────────────────────

EBITDA CALCULATION
Pro Forma EBIT                  $594     $759     $911     $1,072   $1,249
+ Pro Forma D&A                 193      205      218      225      241
Pro Forma EBITDA                $787     $964     $1,129   $1,297   $1,490

DEBT SCHEDULE
Beginning Debt Balance          $1,100   $1,045   $985     $920     $850
  Mandatory Amortization        (50)     (55)     (60)     (65)     (70)
  Optional Prepayment           (5)      (5)      (5)      (5)      (5)
Ending Debt Balance             $1,045   $985     $920     $850     $775

Average Debt                    $1,073   $1,015   $953     $885     $813
Interest Expense @ 5.0%         $50      $50      $48      $46      $44

LEVERAGE RATIOS
Total Debt / EBITDA             1.3x     1.0x     0.8x     0.7x     0.5x
Net Debt / EBITDA               1.2x     0.9x     0.7x     0.5x     0.4x

Target Covenant: < 3.5x         ✓        ✓        ✓        ✓        ✓

COVERAGE RATIOS
EBITDA / Interest               15.7x    19.3x    23.5x    28.2x    33.9x
EBIT / Interest                 11.9x    15.2x    19.0x    23.3x    28.4x
(EBITDA - Capex) / Interest     13.1x    16.5x    20.3x    24.7x    29.9x

Target Covenant: >> 3.0x         ✓        ✓        ✓        ✓        ✓

FREE CASH FLOW METRICS
EBITDA                          $787     $964     $1,129   $1,297   $1,490
- Cash Interest                 (50)     (50)     (48)     (46)     (44)
- Cash Taxes                    (136)    (177)    (216)    (257)    (301)
- Capex                         (132)    (145)    (163)    (181)    (201)
- Change in NWC                 (15)     (18)     (20)     (23)     (25)
Unlevered Free Cash Flow        $454     $574     $682     $790     $919

- Debt Amortization             (55)     (60)     (65)     (70)     (75)
Levered Free Cash Flow          $399     $514     $617     $720     $844

FCF / Total Debt                38.2%    52.2%    67.1%    84.7%    108.9%
FCF Yield on Purchase Price     26.6%    34.3%    41.1%    48.0%    56.3%

RETURNS METRICS
ROIC (Unlevered):
  NOPAT                         $446     $570     $684     $804     $937
  Invested Capital              $1,500   $1,500   $1,500   $1,500   $1,500
  ROIC                          29.7%    38.0%    45.6%    53.6%    62.5%

ROE:
  Net Income                    $408     $532     $647     $770     $904
  Avg. Shareholders' Equity     $2,215   $2,630   $2,630   $2,630   $2,630
  ROE                           18.4%    20.2%    24.6%    29.3%    34.4%
SECTION 7: Sensitivity Analysis Tables
═══════════════════════════════════════════════════════════════
                      SENSITIVITY ANALYSIS
═══════════════════════════════════════════════════════════════

TABLE 1: PURCHASE PRICE vs. ACCRETION (Year 1)
───────────────────────────────────────────────────────────────
                        Purchase Price ($M)
Stock/Cash Mix    $1,300   $1,400   $1,500   $1,600   $1,700
─────────────────────────────────────────────────────────────
100% Stock        (8.2%)   (11.5%)  (14.9%)  (18.1%)  (21.2%)
75% Stock         (9.5%)   (12.9%)  (16.3%)  (19.6%)  (22.8%)
50% Stock         (11.1%)  (14.6%)  (18.0%)  (21.3%)  (24.6%)
25% Stock         (13.2%)  (16.8%)  (20.3%)  (23.7%)  (27.0%)
100% Cash         (16.8%)  (20.5%)  (24.1%)  (27.6%)  (31.0%)

Note: All-stock less dilutive short-term, but all-cash preserves
      future upside for existing shareholders

TABLE 2: SYNERGIES vs. YEAR 3 ACCRETION
───────────────────────────────────────────────────────────────
                     Cost Synergies Realized ($M)
Revenue Syn.      $20      $30      $40      $50      $60
─────────────────────────────────────────────────────────────
$0                (12.1%)  (7.3%)   (2.5%)   2.3%     7.1%
$15               (9.8%)   (5.0%)   (0.2%)   4.6%     9.4%
$30               (7.5%)   (2.7%)   2.1%     6.9%     11.7%
$45               (5.2%)   (0.4%)   4.4%     9.2%     14.0%
$60               (2.9%)   1.9%     6.7%     11.5%    16.3%

Base Case Assumptions: $33M cost synergies, $28M revenue synergies

TABLE 3: ACQUIRER STOCK PRICE vs. YEAR 1 ACCRETION
───────────────────────────────────────────────────────────────
                     Acquirer Stock Price at Close
% Stock Used      $35      $40      $45      $50      $55
─────────────────────────────────────────────────────────────
40%               (14.2%)  (15.1%)  (16.6%)  (18.5%)  (20.8%)
50%               (13.8%)  (14.8%)  (16.3%)  (18.2%)  (20.5%)
60%               (13.3%)  (14.4%)  (15.9%)  (17.9%)  (20.2%)
70%               (12.9%)  (14.0%)  (15.6%)  (17.5%)  (19.9%)
80%               (12.4%)  (13.6%)  (15.2%)  (17.2%)  (19.5%)

Lower stock price = More shares issued = More dilution
Higher stock price = Fewer shares issued = Less dilution

TABLE 4: INTEGRATION COSTS vs. NET SYNERGIES (NPV)
───────────────────────────────────────────────────────────────
                     Integration Costs ($M)
Synergies         $25      $35      $45      $55      $65
─────────────────────────────────────────────────────────────
$50 Run-Rate      $208     $198     $188     $178     $168
$60 Run-Rate      $258     $248     $238     $228     $218
$70 Run-Rate      $308     $298     $288     $278     $268
$80 Run-Rate      $358     $348     $338     $328     $318
$90 Run-Rate      $408     $398     $388     $378     $368

NPV = PV of synergies over 5 years @ 11% WACC - Integration Costs
Base Case: $61M run-rate synergies, $40M integration costs = $238M NPV

TABLE 5: BREAK-EVEN ANALYSIS
───────────────────────────────────────────────────────────────

To achieve Year 1 EPS accretion-neutral ($3.98):

OPTION 1: Reduce Purchase Price
  Maximum EV:                           $1,285M
  Implied EBITDA Multiple:              16.1x
  Current Offer:                        19.4x
  Required Discount:                    17%

OPTION 2: Increase Synergies
  Required Additional Cost Synergies:   $52M (vs. $33M base)
  Increase Required:                    58%

OPTION 3: Change Financing Mix
  Required % Cash (vs. 40% base):       72%
  Additional Debt Required:             $480M
  Pro Forma Leverage:                   4.1x (vs. 1.3x base)

OPTION 4: Combination Approach
  Purchase Price:                       $1,400M (-7%)
  Cost Synergies:                       $42M (+27%)
  % Cash:                               50% (+10pp)
  Result:                               ~0% Y1 Accretion
SECTION 8: Alternative Deal Structure Scenarios
═══════════════════════════════════════════════════════════════
                  DEAL STRUCTURE COMPARISON
═══════════════════════════════════════════════════════════════
                        Scenario A   Scenario B   Scenario C
                        All Stock    50/50 Mix    All Cash
───────────────────────────────────────────────────────────────

DEAL TERMS
Purchase Price ($M)     $1,500       $1,500       $1,500
Stock Consideration     100%         50%          0%
Cash Consideration      0%           50%          100%

FINANCING
New Debt ($M)           $100         $850         $1,600
Stock Issued ($M)       $1,500       $750         $0
Cash Used ($M)          $30          $30          $30

New Shares Issued (M)   33.3         16.7         0.0
Pro Forma Shares (M)    136.3        119.7        103.0

YEAR 1 FINANCIALS
Pro Forma EBIT          $594         $594         $594
Interest Expense        (10)         (48)         (88)
EBT                     584          546          506
Taxes @ 25%             (146)        (137)        (127)
Net Income              $438         $410         $380

EPS                     $3.21        $3.42        $3.69
Standalone EPS          $3.98        $3.98        $3.98
Accretion/(Dilution)    (19.3%)      (14.1%)      (7.3%)

YEAR 3 FINANCIALS
Pro Forma EBIT          $911         $911         $911
Interest Expense        (8)          (43)         (78)
EBT                     903          868          833
Net Income              $677         $651         $625

EPS                     $4.97        $5.44        $6.07
Standalone EPS          $5.45        $5.45        $5.45
Accretion/(Dilution)    (8.8%)       (0.2%)       11.4%

CREDIT METRICS (Year 1)
Total Debt              $600         $1,350       $2,100
EBITDA                  $787         $787         $787
Debt / EBITDA           0.8x         1.7x         2.7x
EBIT / Interest         59.4x        12.4x        6.8x

Rating Implication      AA           A            BBB+
Cost of Debt            4.00%        5.00%        6.00%

STRATEGIC CONSIDERATIONS
─────────────────────────────────────────────────────────────
Scenario A (All Stock):
  ✓ Minimal debt, pristine balance sheet
  ✓ Maximum financial flexibility
  ✓ Aligns incentives (target shareholders stay invested)
  ✗ Significant dilution (25% more shares)
  ✗ Deal value fluctuates with stock price
  ✗ Most dilutive to existing shareholders

Scenario B (50/50 Mix):
  ✓ Balanced approach
  ✓ Moderate leverage
  ✓ Manageable dilution (16% more shares)
  ✓ Maintains investment grade rating
  ≈ Moderate risk/return profile

Scenario C (All Cash):
  ✓ No share dilution
  ✓ Fixed deal value
  ✓ Highest near-term EPS (lowest share count)
  ✗ High leverage (2.7x)
  ✗ Constrains financial flexibility
  ✗ Higher interest burden
  ✗ May require asset sales or equity raise later

RECOMMENDATION: Scenario B (50/50 Mix) offers best balance
SECTION 9: Deal Summary Dashboard
═══════════════════════════════════════════════════════════════
EXECUTIVE SUMMARY METRICS
═══════════════════════════════════════════════════════════════
TRANSACTION OVERVIEW
─────────────────────────────────────────────────────────────
Target Company: TargetCo
Purchase Price: $1,500M
Enterprise Value: $1,550M
Financing: 60% Stock / 40% Debt+Cash
Expected Close: Q2 2025
VALUATION
─────────────────────────────────────────────────────────────
EV / LTM Revenue: 3.9x
EV / LTM EBITDA: 19.4x
EV / LTM EBIT: 25.8x
Premium to Market Price: 25.0%
Benchmark Median Multiples:
Public Comps EV/EBITDA: 17.5x [Above]
Recent M&A EV/EBITDA: 18.2x [Above]
STRATEGIC RATIONALE
─────────────────────────────────────────────────────────────
1. Expand addressable market by $2.5B
2. Accelerate product roadmap by 18-24 months
3. Gain 350 enterprise customers
4. Achieve #1 or #2 market position in 3 verticals
5. Realize $61M annual run-rate synergies
FINANCIAL IMPACT (Year 1 → Year 3)
─────────────────────────────────────────────────────────────
Year 1 Year 3
Revenue $2,660M $3,270M
Growth Rate 10.8% 10.9%
EBITDA $787M $1,129M
Margin 29.6% 34.5%
EPS (Pro Forma) $3.32 $5.26
Accretion/(Dilution) (16.6%) (3.5%)
Free Cash Flow $399M $617M
FCF Yield 26.6% 41.1%
RETURNS ANALYSIS
─────────────────────────────────────────────────────────────
5-Year IRR on Investment: 17.8%
Year 3 ROIC: 45.6%
Year 5 ROIC: 62.5%
Payback Period (undiscounted): 3.2 years
NPV of Synergies (@ 11% WACC): $238M
NPV of Deal (vs. $1,500M price): Positive if synergies >> 85%
RISK FACTORS & MITIGANTS
─────────────────────────────────────────────────────────────
Risk Mitigation
────────────────────────────────────────────────────────────
Integration complexity Dedicated PMO team, 100-day plan
Customer churn (10% modeled) Retention bonuses, customer success
Key talent retention Stay bonuses for top 50 employees
Synergy realization (85% prob) Conservative phasing, external advisors
Regulatory approval Pre-filing with FTC, clean Hart-Scott
CREDIT PROFILE
─────────────────────────────────────────────────────────────
Pro Forma Debt / EBITDA: 1.3x
Interest Coverage: 15.7x
Pro Forma Rating: A (Stable)
Covenant Headroom:
Max Leverage (3.5x): 2.2x headroom ✓
Min Interest Coverage (3.0x): 12.7x headroom ✓
GOVERNANCE & APPROVALS
─────────────────────────────────────────────────────────────
Board Approval Required: Yes (>$1B transaction)
Shareholder Vote Required: Yes (>20% dilution)
Regulatory Approvals: Hart-Scott-Rodino (HSR)
Expected Vote Support: 75%+ (based on investor calls)
GO / NO-GO DECISION CRITERIA
─────────────────────────────────────────────────────────────
Criterion Target Actual Status
──────────────────────────────────────────────────────────────
EV/EBITDA < 20x <20x 19.4x ✓ PASS
Year 3 Accretive >>0% (3.5%) ✗ MISS
Debt/EBITDA < 2.5x <2.5x 1.3x ✓ PASS
ROIC > WACC by Year 3 >>11% 45.6% ✓ PASS
Synergy NPV > $200M >>$200M $238M ✓ PASS
Strategic Fit Score >>8/10 9/10 ✓ PASS
Integration Risk Medium Medium ✓ PASS
Overall Assessment: PROCEED
(6 of 7 pass)
SECTION 10: Model Usage Instructions
Step 1: Input Collection
Fill in all blue-highlighted cells in Section 1 (Transaction Assumptions). Ensure you have:
• Audited financials for both companies (3 years historical)
• Management projections
• Current stock prices and share counts
• Debt terms and schedules
• Quality of earnings adjustments
Step 2: PPA Development
Work with external valuation firm or accounting team to:
• Identify all intangible assets
• Determine fair values
• Assign useful lives
• Calculate deferred tax impacts
Step 3: Synergy Validation
Build bottom-up synergy analysis:
• Interview functional leaders (HR, IT, Facilities, Ops)
• Get specific headcount reduction lists
• Model revenue synergies conservatively
• Account for dis-synergies (churn, disruption)
• Estimate integration costs and timing
Step 4: Scenario Analysis
Build 3 cases (Base, Upside, Downside):
• Vary key assumptions (growth, synergies, price)
• Stress test financing structures
• Run sensitivities on critical variables
• Calculate break-even thresholds
Step 5: Validation & Review
Before presenting:
• Verify all formulas link correctly
• Check that balance sheet balances
• Confirm sources = uses
• Review reasonableness of all metrics
• Compare to comparable transactions
• Prepare answers to obvious objections
Common Checks
✓ Pro forma shares = Acquirer shares + New shares issued
✓ PPA intangibles + Goodwill = Purchase price - Fair value of net assets
✓ Interest expense = Average debt × Interest rate
✓ Taxes = Pre-tax income × Effective tax rate
✓ Cash flow statement ties to balance sheet changes
✓ All percentages sum to 100% where applicable
✓ No #REF, #DIV/0, or #VALUE errors
Model Maintenance Best Practices
Version Control:
- Save dated versions (MergerModel_2025-01-30_v1.xlsx)
- Track major assumption changes in change log
- Use Excel's "Track Changes" for collaborative reviews
- Maintain separate tabs for each scenario
Documentation:
- Add comments to all key assumption cells
- Document data sources (where did this number come from?)
- Explain any unusual adjustments
- Keep supporting schedules organized
Flexibility:
- Use named ranges for key inputs
- Build dropdown menus for scenarios
- Color code: Blue = Input, Black = Formula, Green = Link
- Avoid hard-coding; use cell references
Presentation:
- Keep output tabs clean and print-friendly
- Use conditional formatting for quick insights
- Build executive summary dashboard
- Create board-ready charts and graphs
Updates:
- Refresh model as new information arrives
- Update market data (stock prices, interest rates) daily during active negotiations
- Adjust synergies based on due diligence findings
- Revise timing assumptions as integration planning progresses
References
- Rosenbaum & Pearl - Investment Banking: Valuation, LBOs, M&A, and IPOs
- M&A Modeling - Wall Street Prep
- Accretion/Dilution Analysis - Corporate Finance Institute
- Purchase Price Allocation - Deloitte M&A Accounting Guide
- Merger Consequences - McKinsey on M&A
- ASC 805 Business Combinations - FASB
- Credit Metrics for M&A - S&P Global Ratings
- Merger Model Best Practices - EY M&A Valuations
© 2026 CorpDev.Ai Unified Process for M&A
Last updated: Wed Jan 29 2025 19:00:00 GMT-0500 (Eastern Standard Time)