M&A Operations Overview
Running an effective M&A function requires more than just deal execution skills—it demands robust operational infrastructure including cadences, governance, reporting, and processes that enable consistent deal flow, disciplined decision-making, and value creation.
What is M&A Operations?
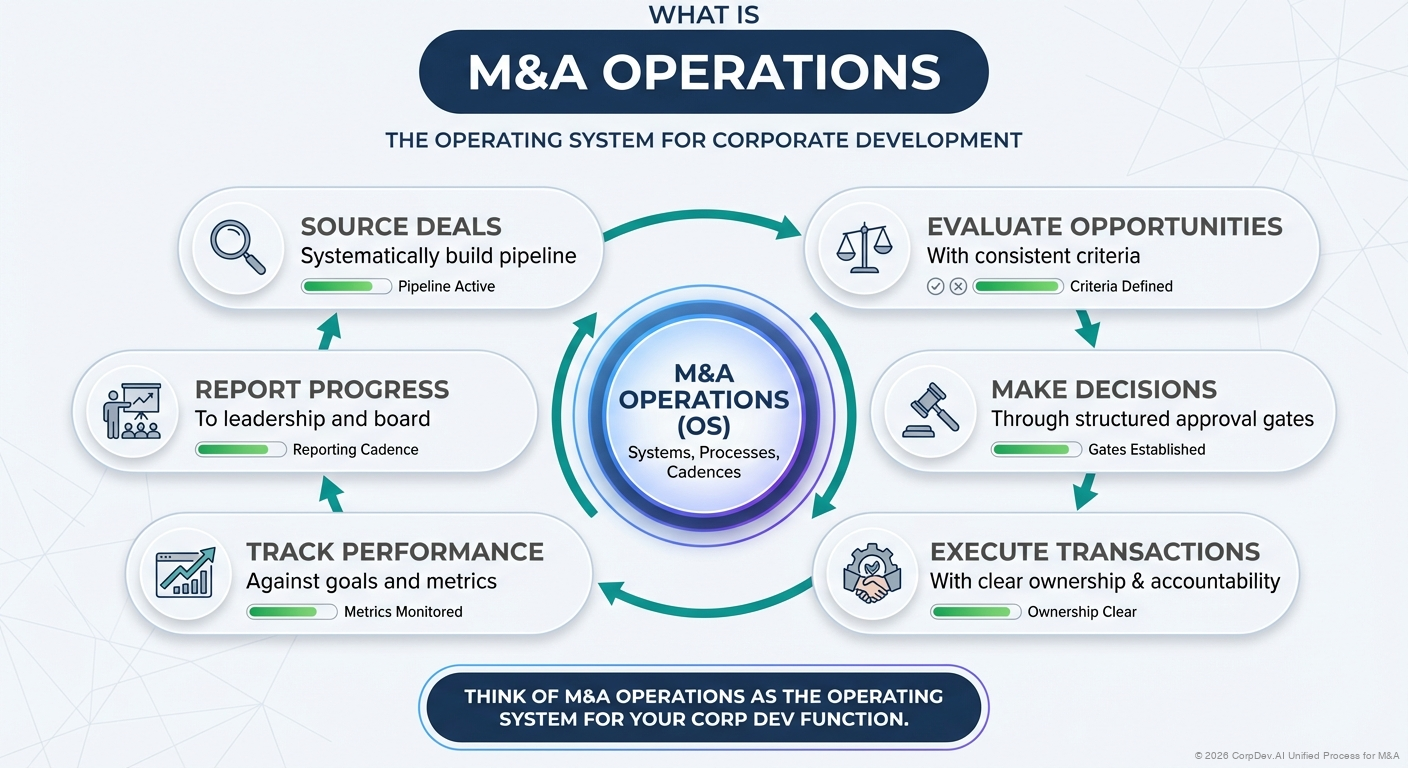
M&A Operations encompasses the systems, processes, and cadences that enable a Corporate Development team to:
- Source deals systematically and build pipeline
- Evaluate opportunities with consistent criteria
- Make decisions through structured approval gates
- Execute transactions with clear ownership and accountability
- Track performance against goals and metrics
- Report progress to leadership and board
Think of M&A Operations as the operating system for your corp dev function.
Why M&A Operations Matter
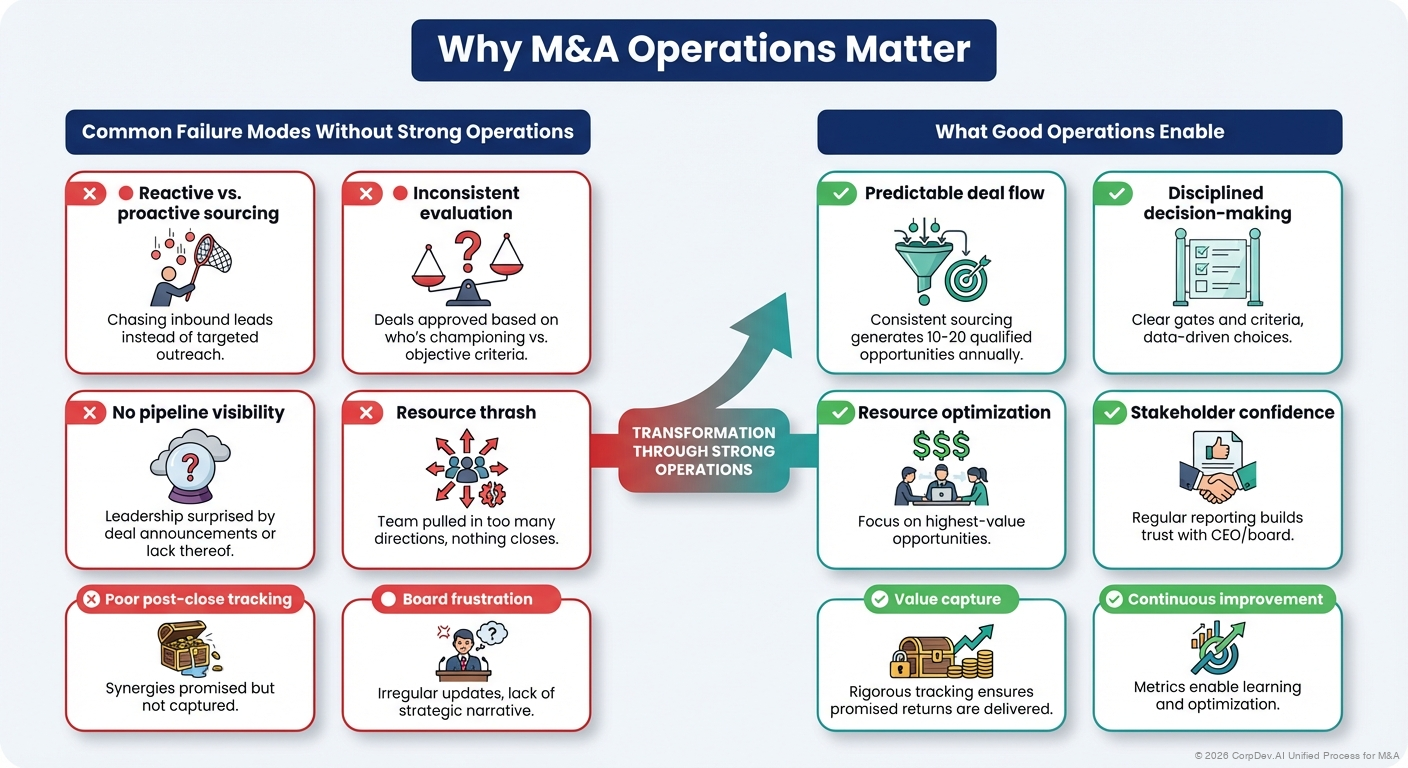
Common Failure Modes Without Strong Operations
- 🔴 Reactive vs. proactive sourcing - chasing inbound leads instead of targeted outreach
- 🔴 Inconsistent evaluation - deals approved based on who's championing vs. objective criteria
- 🔴 No pipeline visibility - leadership surprised by deal announcements or lack thereof
- 🔴 Resource thrash - team pulled in too many directions, nothing closes
- 🔴 Poor post-close tracking - synergies promised but not captured
- 🔴 Board frustration - irregular updates, lack of strategic narrative
What Good Operations Enable
- ✅ Predictable deal flow - consistent sourcing generates 10-20 qualified opportunities annually
- ✅ Disciplined decision-making - clear gates and criteria, data-driven choices
- ✅ Resource optimization - focus on highest-value opportunities
- ✅ Stakeholder confidence - regular reporting builds trust with CEO/board
- ✅ Value capture - rigorous tracking ensures promised returns are delivered
- ✅ Continuous improvement - metrics enable learning and optimization
M&A Operations Framework
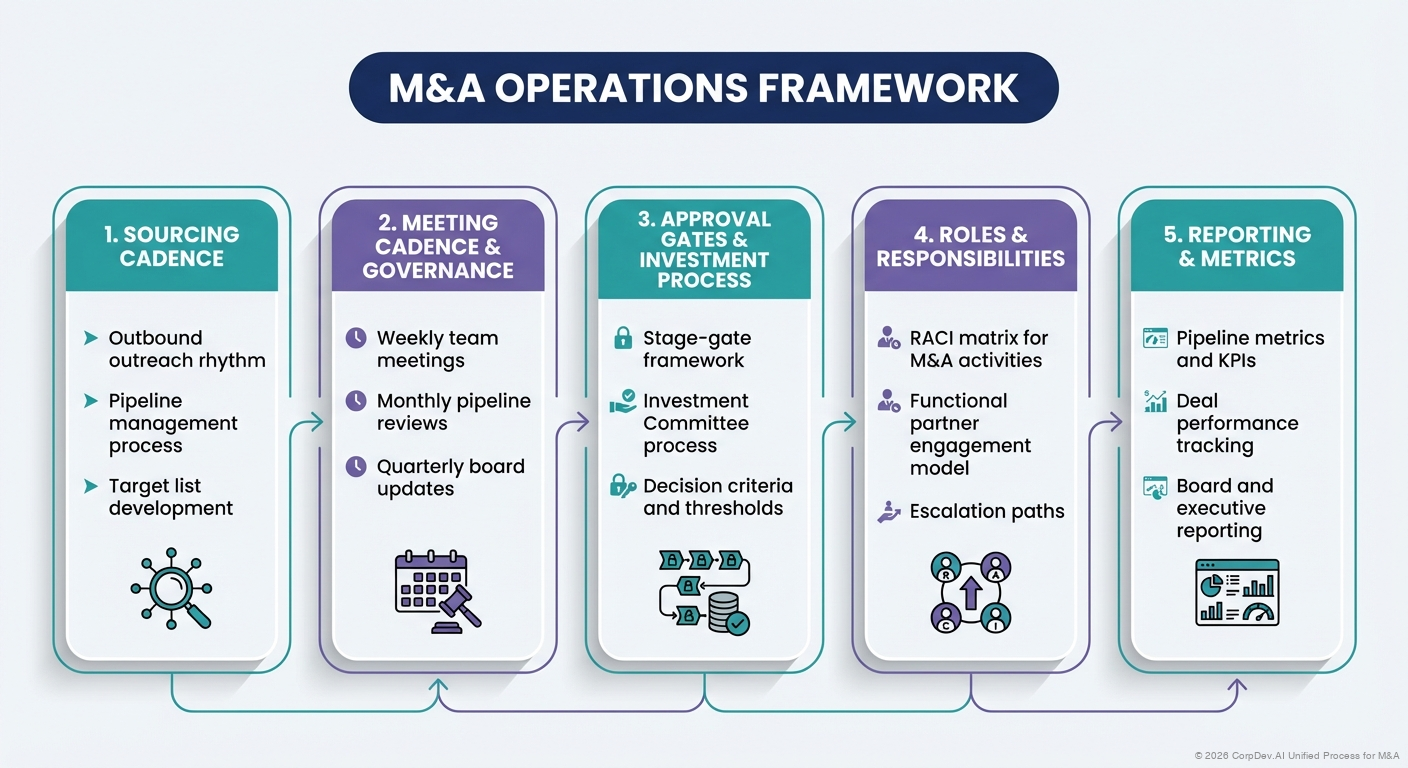
The Five Pillars
┌─────────────────────────────────────────────────────────┐
│                    M&A OPERATIONS                        │
├─────────────────────────────────────────────────────────┤
│                                                          │
│  1. SOURCING CADENCE                                    │
│     • Outbound outreach rhythm                          │
│     • Pipeline management process                       │
│     • Target list development                           │
│                                                          │
│  2. MEETING CADENCE & GOVERNANCE                        │
│     • Weekly team meetings                              │
│     • Monthly pipeline reviews                          │
│     • Quarterly board updates                           │
│                                                          │
│  3. APPROVAL GATES & INVESTMENT PROCESS                 │
│     • Stage-gate framework                              │
│     • Investment Committee process                      │
│     • Decision criteria and thresholds                  │
│                                                          │
│  4. ROLES & RESPONSIBILITIES                            │
│     • RACI matrix for M&A activities                    │
│     • Functional partner engagement model               │
│     • Escalation paths                                  │
│                                                          │
│  5. REPORTING & METRICS                                 │
│     • Pipeline metrics and KPIs                         │
│     • Deal performance tracking                         │
│     • Board and executive reporting                     │
│                                                          │
└─────────────────────────────────────────────────────────┘
Pillar 1: Sourcing Cadence
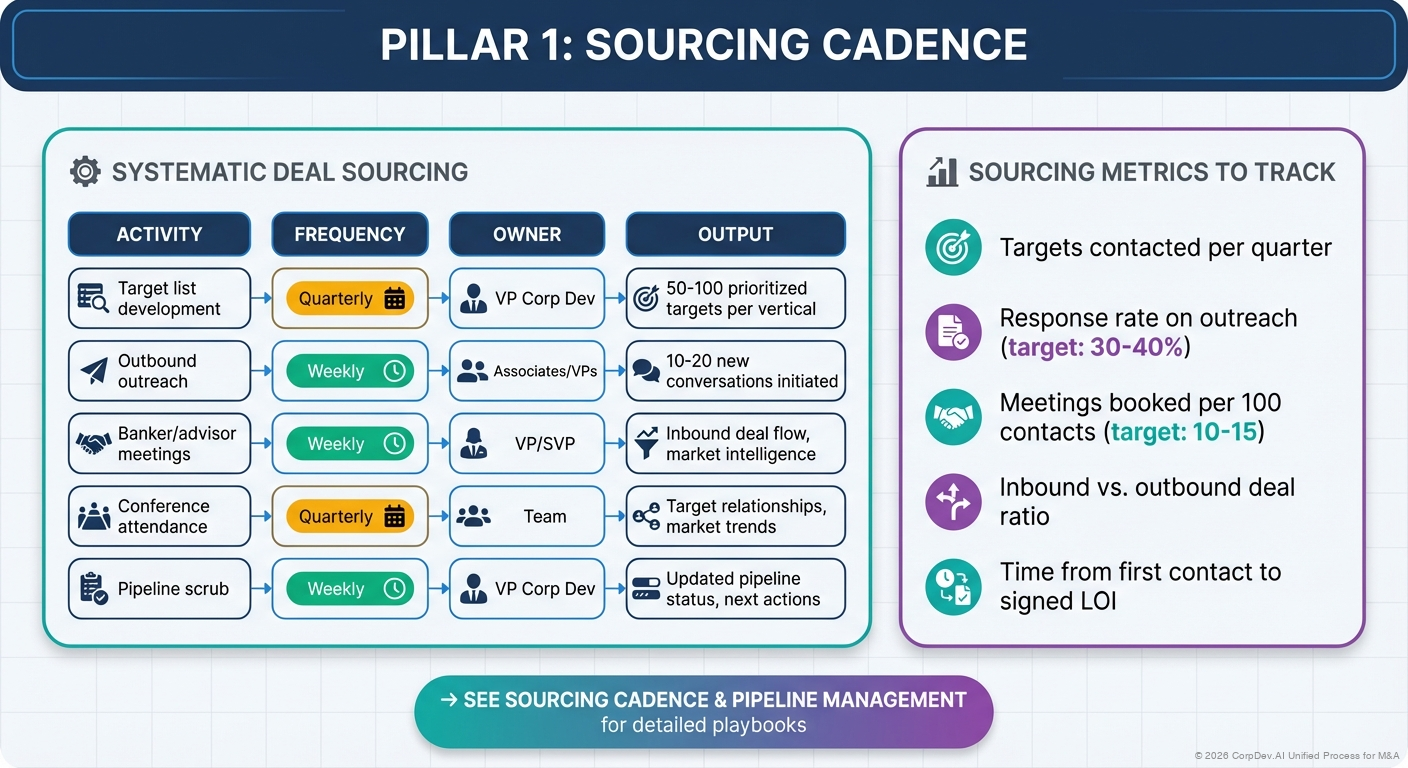
Systematic Deal Sourcing
| Activity | Frequency | Owner | Output |
|---|---|---|---|
| Target list development | Quarterly | VP Corp Dev | 50-100 prioritized targets per vertical |
| Outbound outreach | Weekly | Associates/VPs | 10-20 new conversations initiated |
| Banker/advisor meetings | Weekly | VP/SVP | Inbound deal flow, market intelligence |
| Conference attendance | Quarterly | Team | Target relationships, market trends |
| Pipeline scrub | Weekly | VP Corp Dev | Updated pipeline status, next actions |
Sourcing Metrics to Track
- Targets contacted per quarter
- Response rate on outreach (target: 30-40%)
- Meetings booked per 100 contacts (target: 10-15)
- Inbound vs. outbound deal ratio
- Time from first contact to signed LOI
→ See Sourcing Cadence & Pipeline Management for detailed playbooks
Pillar 2: Meeting Cadence & Governance
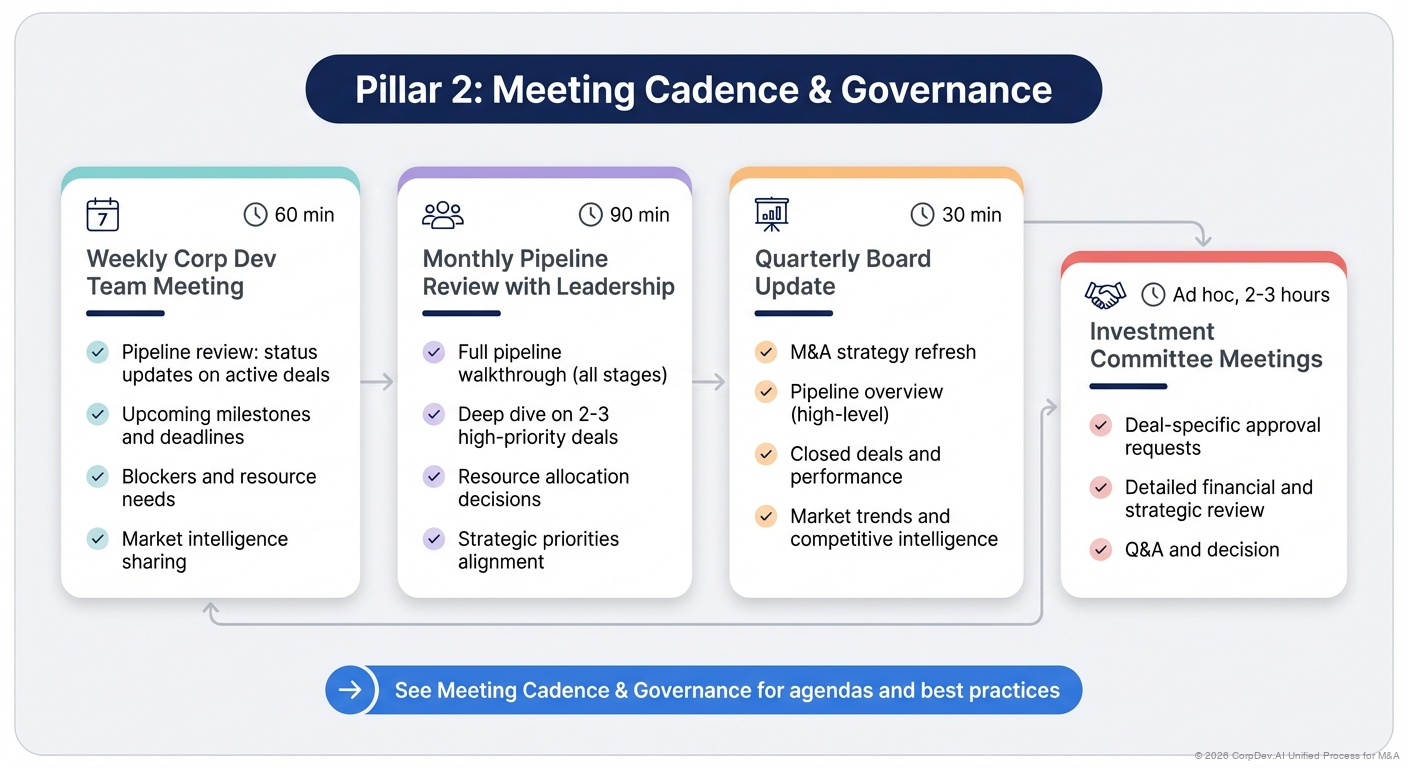
Weekly Corp Dev Team Meeting (60 min)
- Pipeline review: status updates on active deals
- Upcoming milestones and deadlines
- Blockers and resource needs
- Market intelligence sharing
Monthly Pipeline Review with Leadership (90 min)
- Full pipeline walkthrough (all stages)
- Deep dive on 2-3 high-priority deals
- Resource allocation decisions
- Strategic priorities alignment
Quarterly Board Update (30 min)
- M&A strategy refresh
- Pipeline overview (high-level)
- Closed deals and performance
- Market trends and competitive intelligence
Investment Committee Meetings (ad hoc, 2-3 hours)
- Deal-specific approval requests
- Detailed financial and strategic review
- Q&A and decision
→ See Meeting Cadence & Governance for agendas and best practices
Pillar 3: Approval Gates & Investment Process
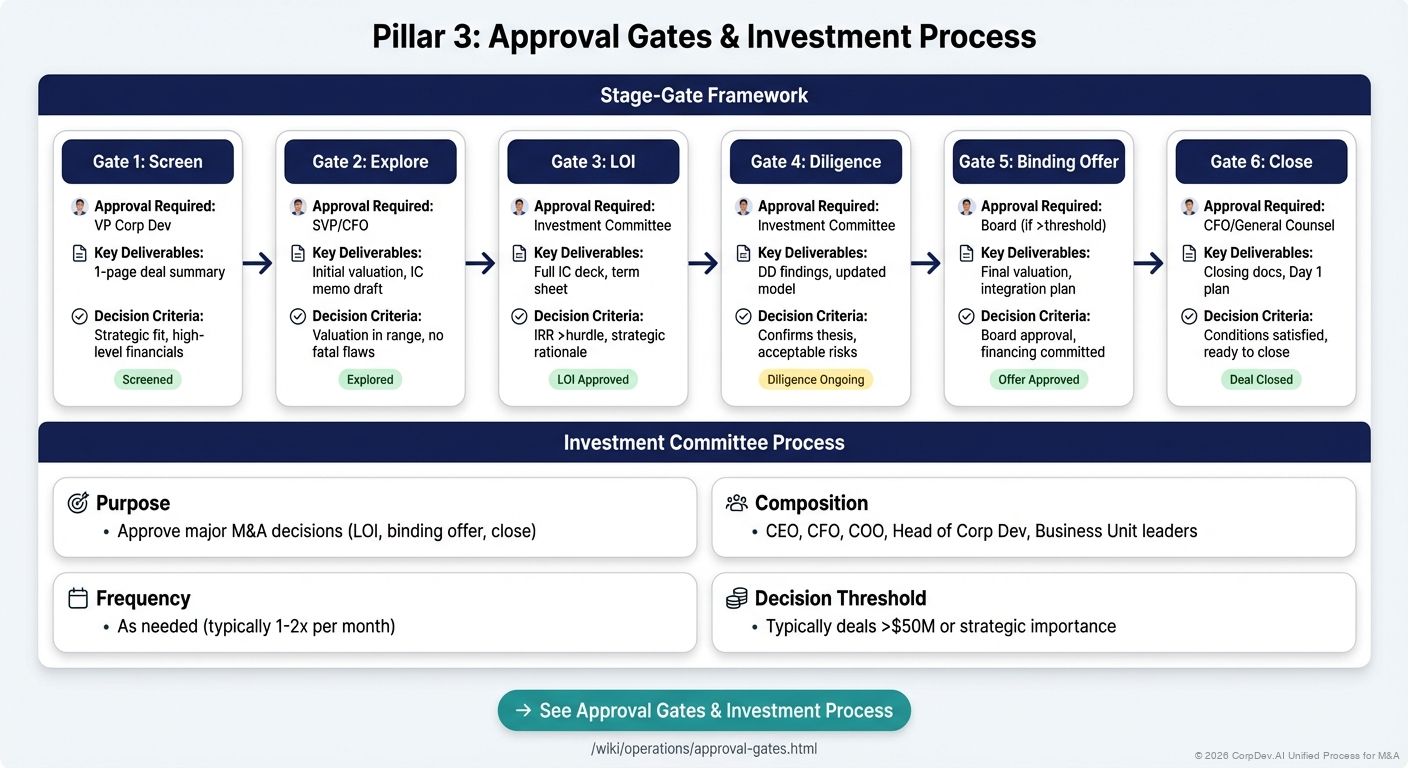
Stage-Gate Framework
| Gate | Approval Required | Key Deliverables | Decision Criteria |
|---|---|---|---|
| Gate 1: Screen | VP Corp Dev | 1-page deal summary | Strategic fit, high-level financials |
| Gate 2: Explore | SVP/CFO | Initial valuation, IC memo draft | Valuation in range, no fatal flaws |
| Gate 3: LOI | Investment Committee | Full IC deck, term sheet | IRR >hurdle, strategic rationale |
| Gate 4: Diligence | Investment Committee | DD findings, updated model | Confirms thesis, acceptable risks |
| Gate 5: Binding Offer | Board (if >threshold) | Final valuation, integration plan | Board approval, financing committed |
| Gate 6: Close | CFO/General Counsel | Closing docs, Day 1 plan | Conditions satisfied, ready to close |
Investment Committee Process
- Purpose: Approve major M&A decisions (LOI, binding offer, close)
- Composition: CEO, CFO, COO, Head of Corp Dev, Business Unit leaders
- Frequency: As needed (typically 1-2x per month)
- Decision Threshold: Typically deals >$50M or strategic importance
→ See Approval Gates & Investment Process for detailed gate requirements
Pillar 4: Roles & Responsibilities
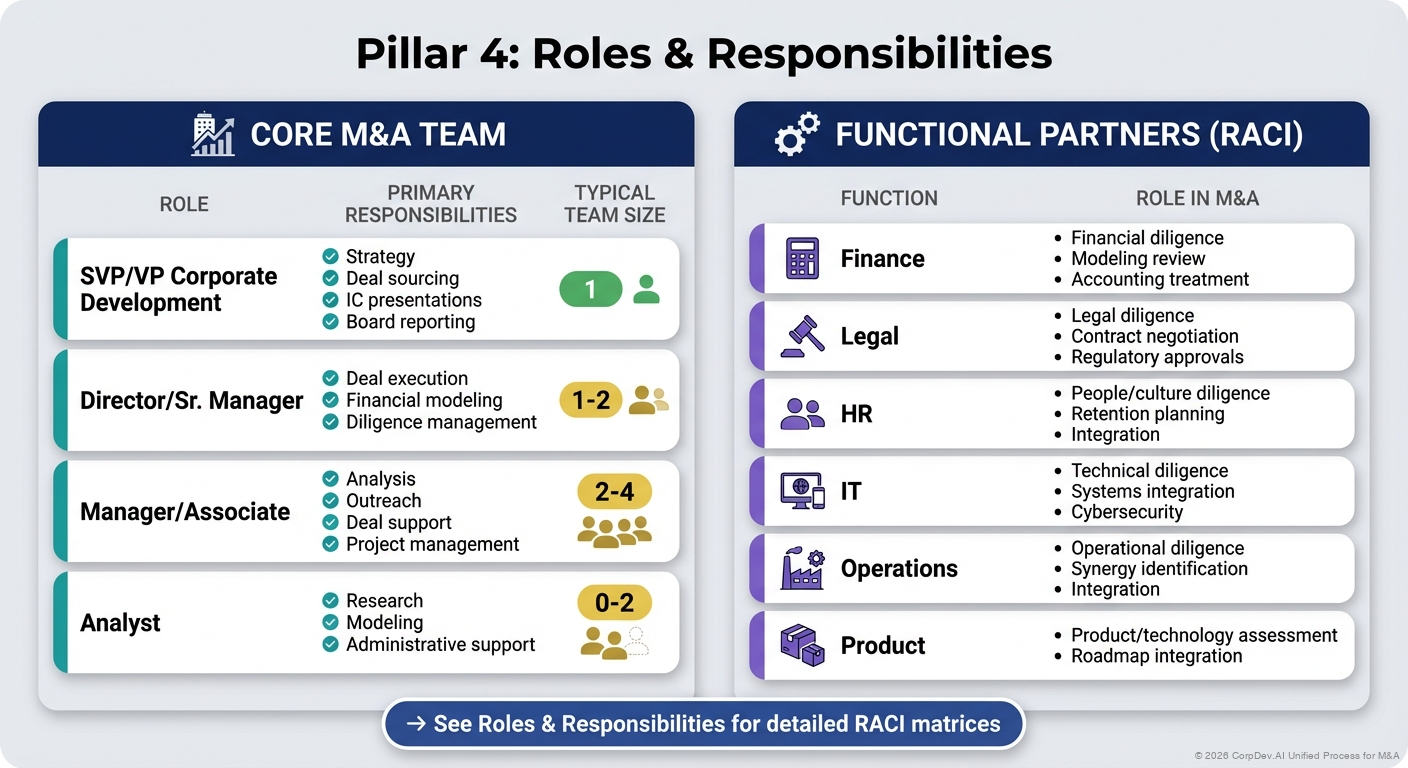
Core M&A Team
| Role | Primary Responsibilities | Typical Team Size |
|---|---|---|
| SVP/VP Corporate Development | Strategy, deal sourcing, IC presentations, board reporting | 1 |
| Director/Sr. Manager | Deal execution, financial modeling, diligence management | 1-2 |
| Manager/Associate | Analysis, outreach, deal support, project management | 2-4 |
| Analyst | Research, modeling, administrative support | 0-2 |
Functional Partners (RACI)
| Function | Role in M&A |
|---|---|
| Finance | Financial diligence, modeling review, accounting treatment |
| Legal | Legal diligence, contract negotiation, regulatory approvals |
| HR | People/culture diligence, retention planning, integration |
| IT | Technical diligence, systems integration, cybersecurity |
| Operations | Operational diligence, synergy identification, integration |
| Product | Product/technology assessment, roadmap integration |
→ See Roles & Responsibilities for detailed RACI matrices
Pillar 5: Reporting & Metrics
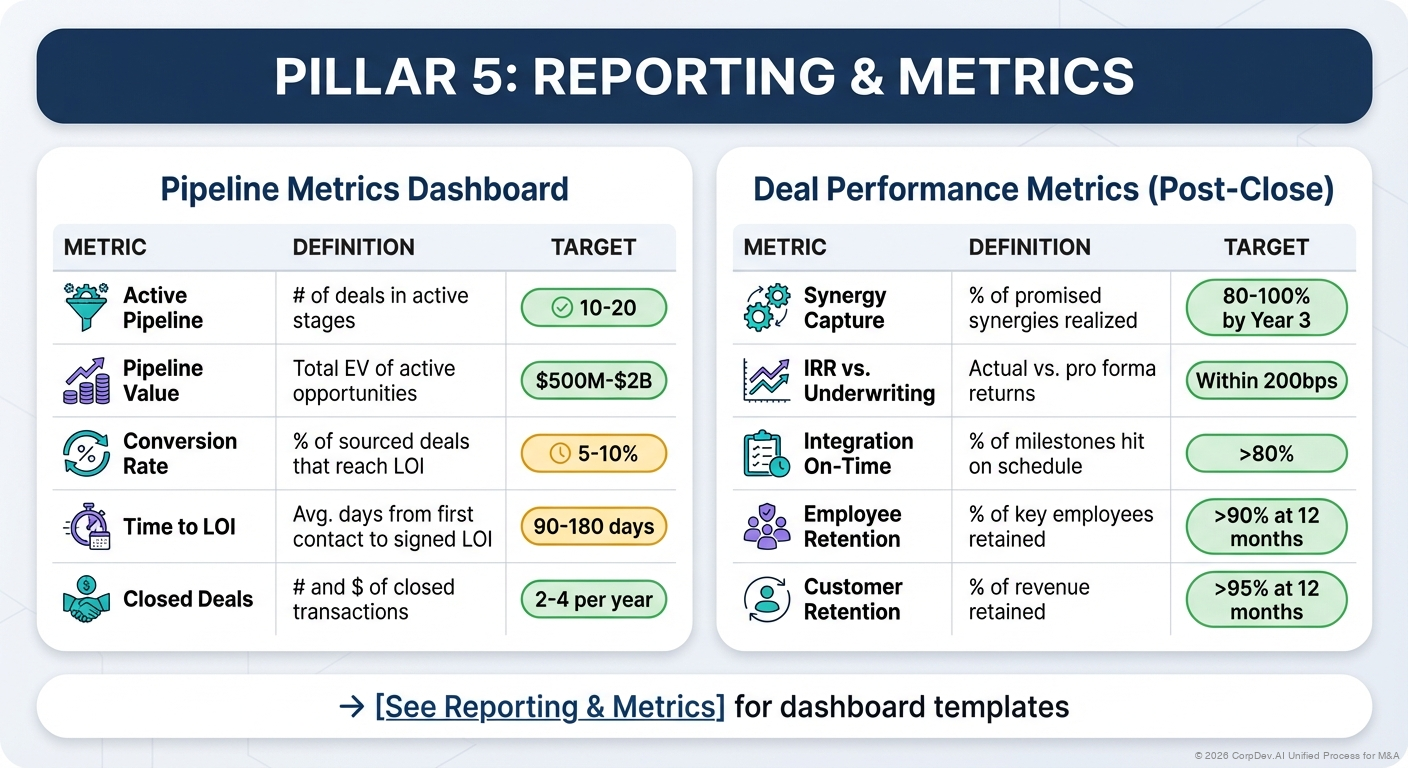
Pipeline Metrics Dashboard
| Metric | Definition | Target |
|---|---|---|
| Active Pipeline | # of deals in active stages | 10-20 |
| Pipeline Value | Total EV of active opportunities | $500M-$2B |
| Conversion Rate | % of sourced deals that reach LOI | 5-10% |
| Time to LOI | Avg. days from first contact to signed LOI | 90-180 days |
| Closed Deals | # and $ of closed transactions | 2-4 per year |
Deal Performance Metrics (Post-Close)
| Metric | Definition | Target |
|---|---|---|
| Synergy Capture | % of promised synergies realized | 80-100% by Year 3 |
| IRR vs. Underwriting | Actual vs. pro forma returns | Within 200bps |
| Integration On-Time | % of milestones hit on schedule | >80% |
| Employee Retention | % of key employees retained | >90% at 12 months |
| Customer Retention | % of revenue retained | >95% at 12 months |
→ See Reporting & Metrics for dashboard templates
Board Reporting
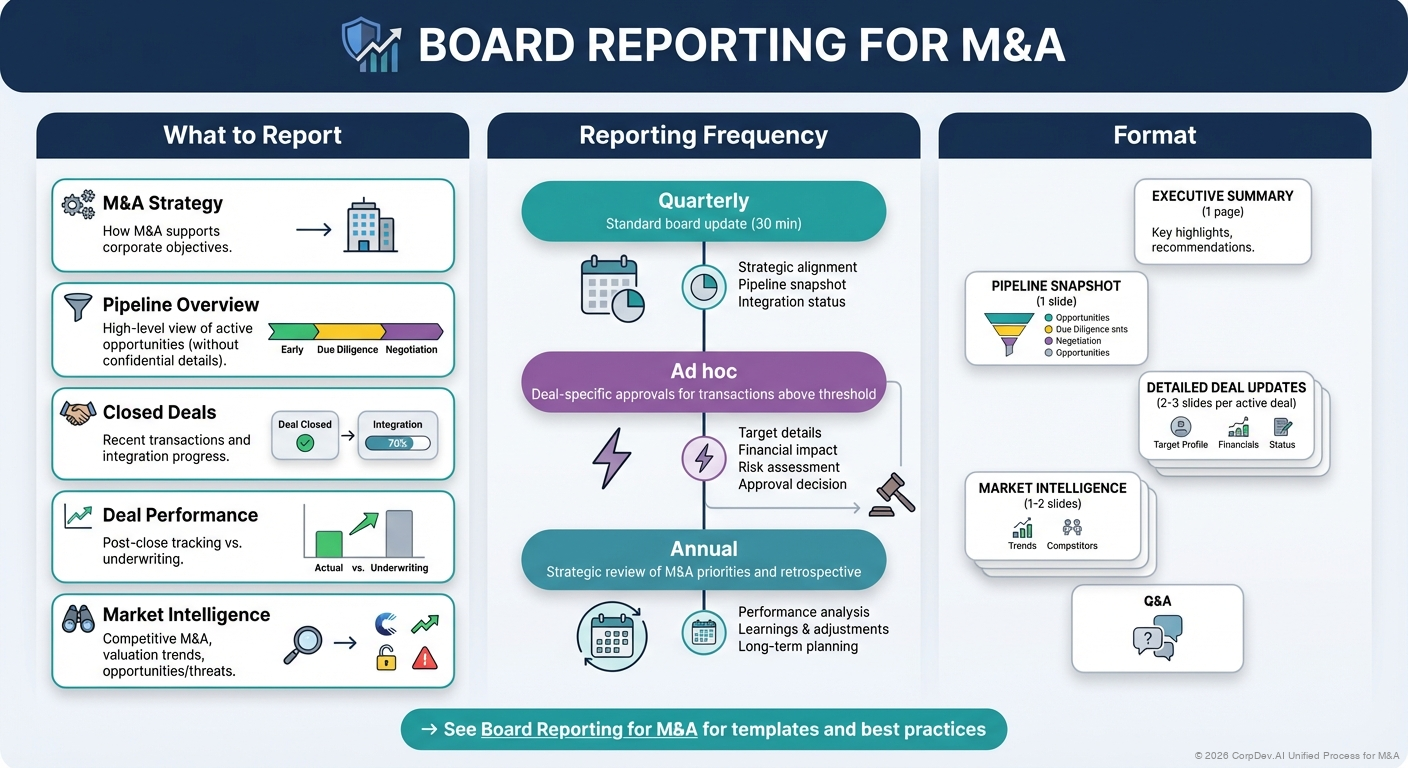
What to Report
- M&A Strategy - How M&A supports corporate objectives
- Pipeline Overview - High-level view of active opportunities (without confidential details)
- Closed Deals - Recent transactions and integration progress
- Deal Performance - Post-close tracking vs. underwriting
- Market Intelligence - Competitive M&A, valuation trends, opportunities/threats
Reporting Frequency
- Quarterly: Standard board update (30 min)
- Ad hoc: Deal-specific approvals for transactions above threshold
- Annual: Strategic review of M&A priorities and retrospective
Format
- Executive summary (1 page)
- Pipeline snapshot (1 slide)
- Detailed deal updates (2-3 slides per active deal)
- Market intelligence (1-2 slides)
- Q&A
→ See Board Reporting for M&A for templates and best practices
Operating Rhythms by Team Size
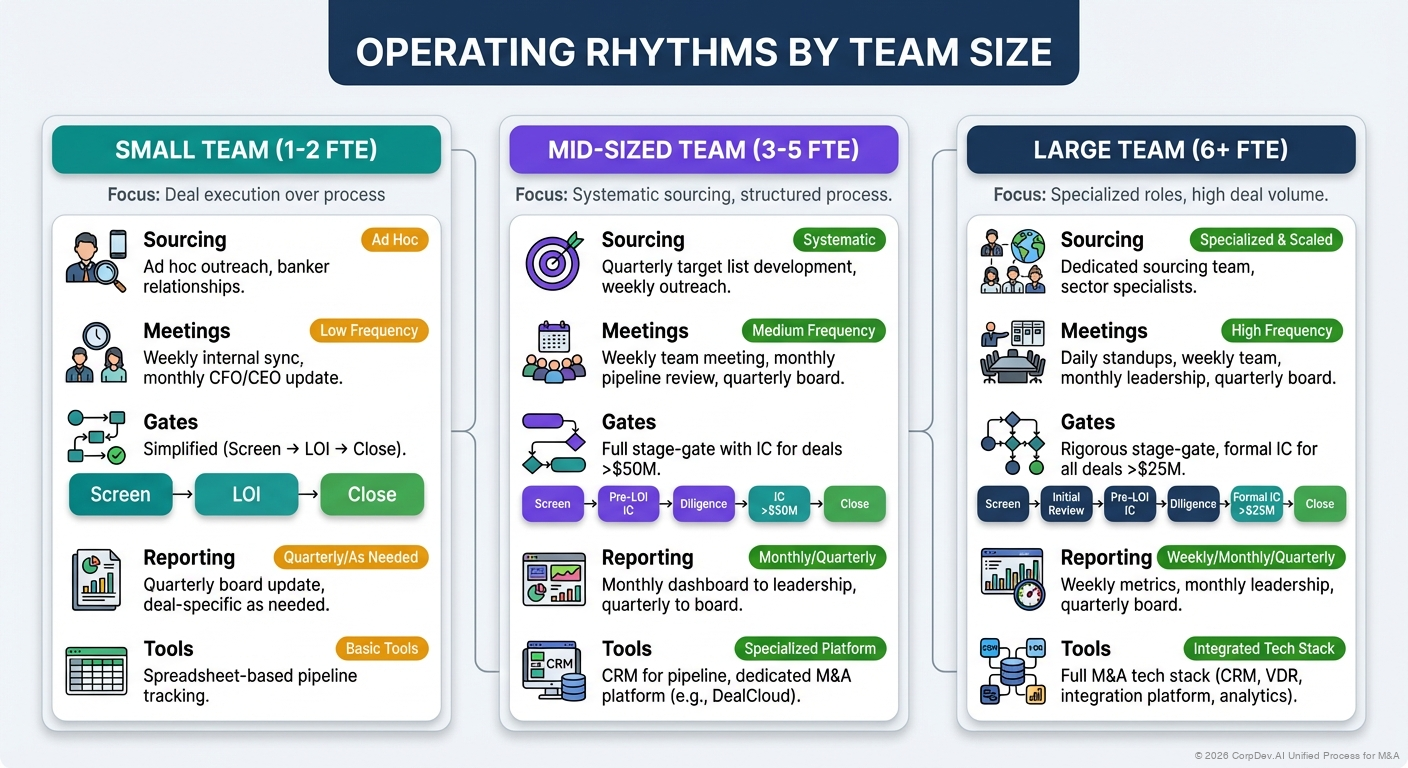
Small Team (1-2 FTE)
Focus: Deal execution over process
- Sourcing: Ad hoc outreach, banker relationships
- Meetings: Weekly internal sync, monthly CFO/CEO update
- Gates: Simplified (Screen → LOI → Close)
- Reporting: Quarterly board update, deal-specific as needed
- Tools: Spreadsheet-based pipeline tracking
Mid-Sized Team (3-5 FTE)
Focus: Systematic sourcing, structured process
- Sourcing: Quarterly target list development, weekly outreach
- Meetings: Weekly team meeting, monthly pipeline review, quarterly board
- Gates: Full stage-gate with IC for deals >$50M
- Reporting: Monthly dashboard to leadership, quarterly to board
- Tools: CRM for pipeline, dedicated M&A platform (e.g., DealCloud)
Large Team (6+ FTE)
Focus: Specialized roles, high deal volume
- Sourcing: Dedicated sourcing team, sector specialists
- Meetings: Daily standups, weekly team, monthly leadership, quarterly board
- Gates: Rigorous stage-gate, formal IC for all deals >$25M
- Reporting: Weekly metrics, monthly leadership, quarterly board
- Tools: Full M&A tech stack (CRM, VDR, integration platform, analytics)
Building M&A Operations: Getting Started
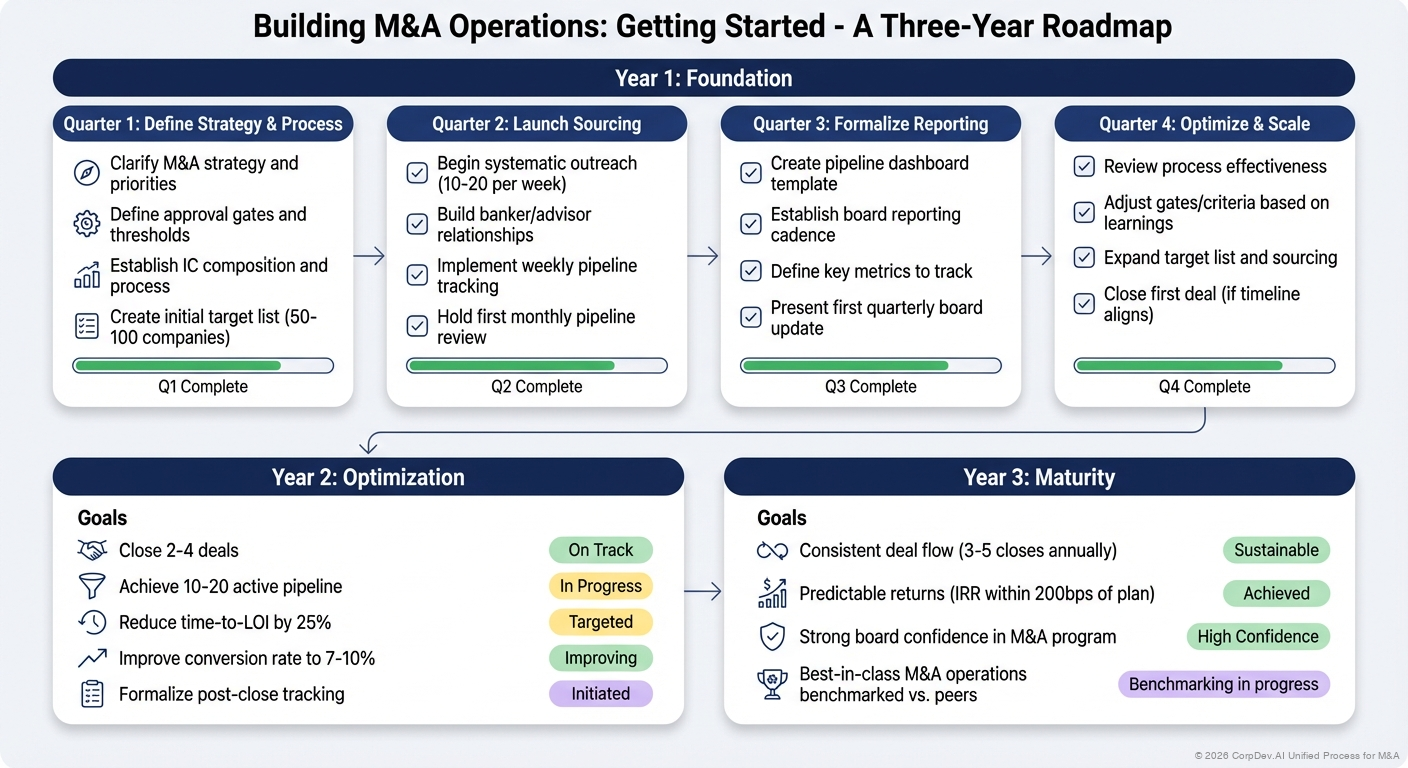
Year 1: Foundation
Quarter 1: Define Strategy & Process
- Clarify M&A strategy and priorities
- Define approval gates and thresholds
- Establish IC composition and process
- Create initial target list (50-100 companies)
Quarter 2: Launch Sourcing
- Begin systematic outreach (10-20 per week)
- Build banker/advisor relationships
- Implement weekly pipeline tracking
- Hold first monthly pipeline review
Quarter 3: Formalize Reporting
- Create pipeline dashboard template
- Establish board reporting cadence
- Define key metrics to track
- Present first quarterly board update
Quarter 4: Optimize & Scale
- Review process effectiveness
- Adjust gates/criteria based on learnings
- Expand target list and sourcing
- Close first deal (if timeline aligns)
Year 2: Optimization
Goals
- Close 2-4 deals
- Achieve 10-20 active pipeline
- Reduce time-to-LOI by 25%
- Improve conversion rate to 7-10%
- Formalize post-close tracking
Year 3: Maturity
Goals
- Consistent deal flow (3-5 closes annually)
- Predictable returns (IRR within 200bps of plan)
- Strong board confidence in M&A program
- Best-in-class M&A operations benchmarked vs. peers
Common Operational Challenges
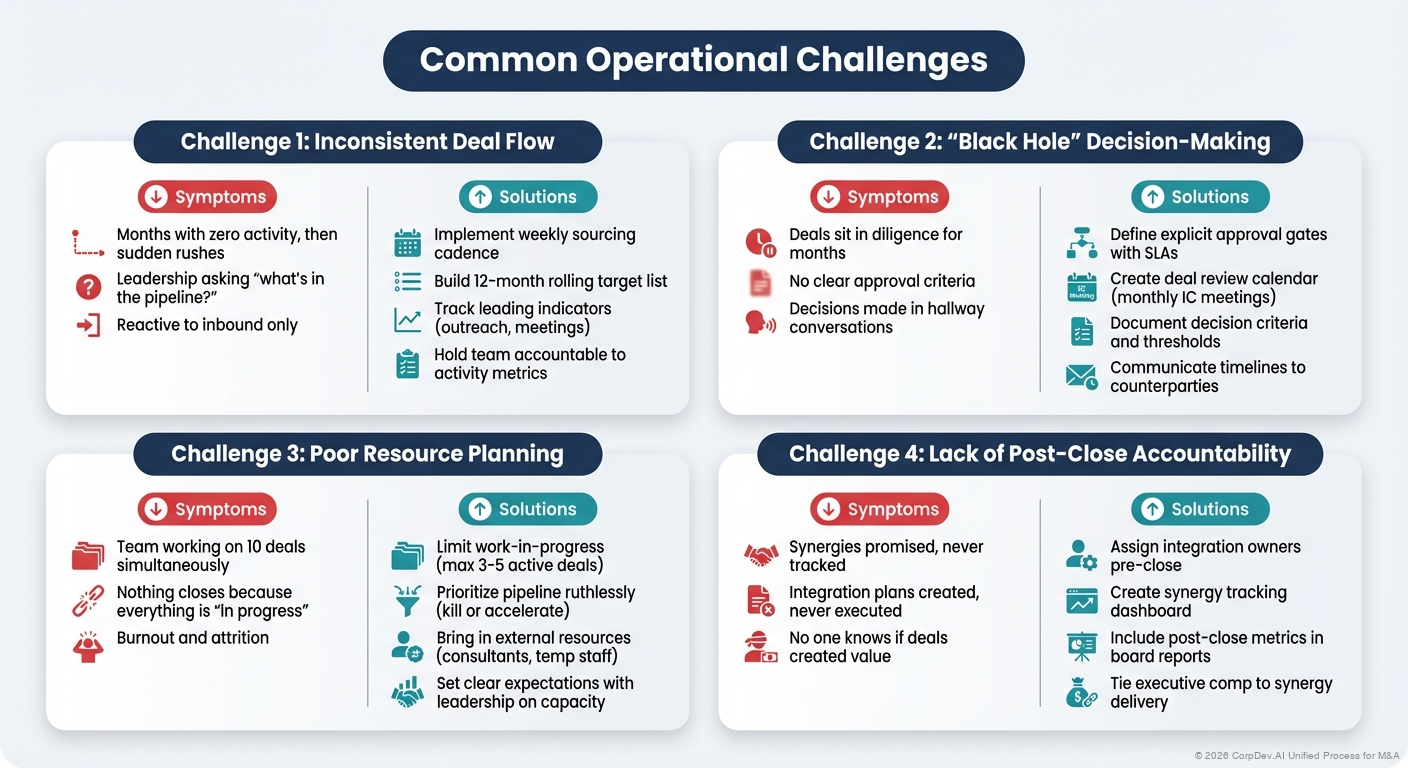
Challenge 1: Inconsistent Deal Flow
Symptoms
- Months with zero activity, then sudden rushes
- Leadership asking "what's in the pipeline?"
- Reactive to inbound only
Solutions
- Implement weekly sourcing cadence
- Build 12-month rolling target list
- Track leading indicators (outreach, meetings)
- Hold team accountable to activity metrics
Challenge 2: "Black Hole" Decision-Making
Symptoms
- Deals sit in diligence for months
- No clear approval criteria
- Decisions made in hallway conversations
Solutions
- Define explicit approval gates with SLAs
- Create deal review calendar (monthly IC meetings)
- Document decision criteria and thresholds
- Communicate timelines to counterparties
Challenge 3: Poor Resource Planning
Symptoms
- Team working on 10 deals simultaneously
- Nothing closes because everything is "in progress"
- Burnout and attrition
Solutions
- Limit work-in-progress (max 3-5 active deals)
- Prioritize pipeline ruthlessly (kill or accelerate)
- Bring in external resources (consultants, temp staff)
- Set clear expectations with leadership on capacity
Challenge 4: Lack of Post-Close Accountability
Symptoms
- Synergies promised, never tracked
- Integration plans created, never executed
- No one knows if deals created value
Solutions
- Assign integration owners pre-close
- Create synergy tracking dashboard
- Include post-close metrics in board reports
- Tie executive comp to synergy delivery
M&A Operations Maturity Model
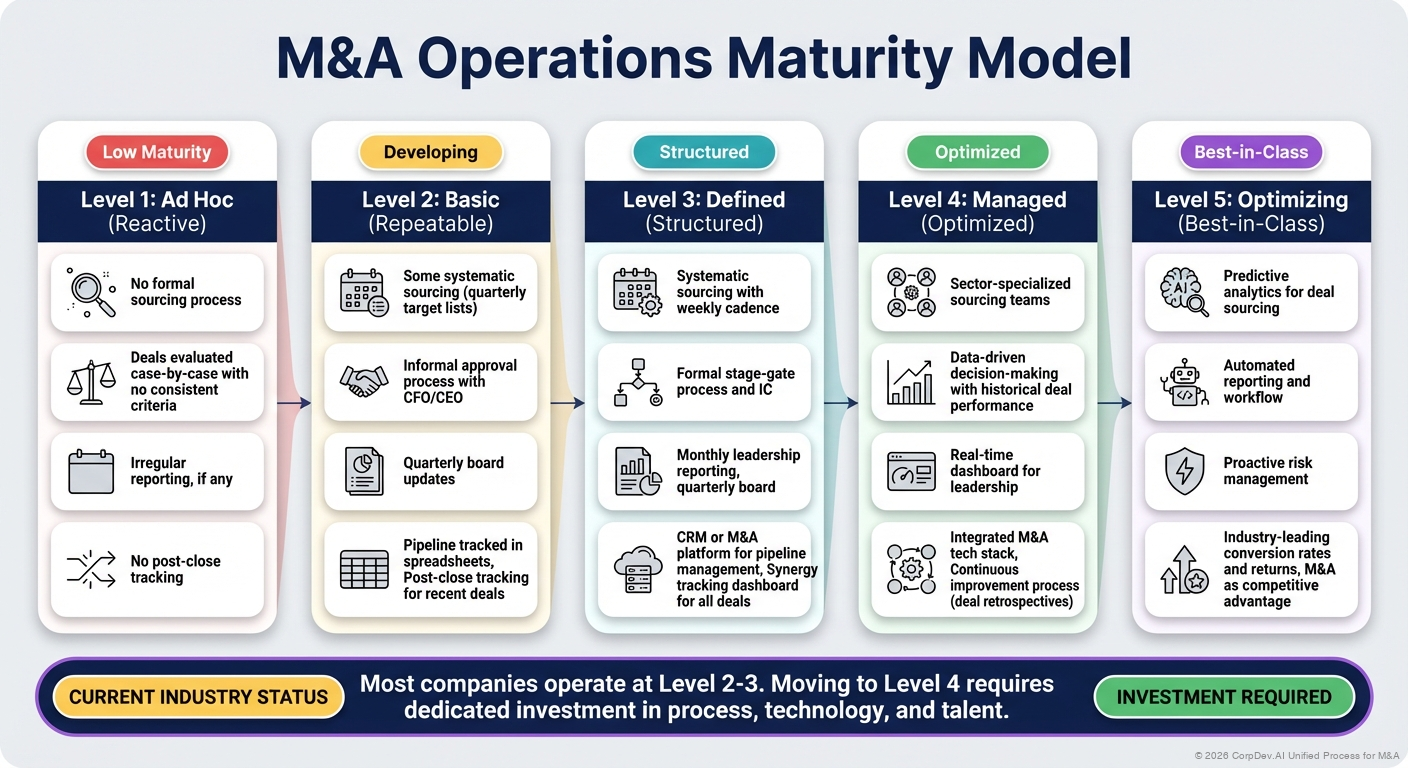
Level 1: Ad Hoc (Reactive)
- No formal sourcing process
- Deals evaluated case-by-case with no consistent criteria
- Irregular reporting, if any
- No post-close tracking
Level 2: Basic (Repeatable)
- Some systematic sourcing (quarterly target lists)
- Informal approval process with CFO/CEO
- Quarterly board updates
- Pipeline tracked in spreadsheets
- Post-close tracking for recent deals
Level 3: Defined (Structured)
- Systematic sourcing with weekly cadence
- Formal stage-gate process and IC
- Monthly leadership reporting, quarterly board
- CRM or M&A platform for pipeline management
- Synergy tracking dashboard for all deals
Level 4: Managed (Optimized)
- Sector-specialized sourcing teams
- Data-driven decision-making with historical deal performance
- Real-time dashboard for leadership
- Integrated M&A tech stack
- Continuous improvement process (deal retrospectives)
Level 5: Optimizing (Best-in-Class)
- Predictive analytics for deal sourcing
- Automated reporting and workflow
- Proactive risk management
- Industry-leading conversion rates and returns
- M&A as competitive advantage
Most companies operate at Level 2-3. Moving to Level 4 requires dedicated investment in process, technology, and talent.
Key Takeaways
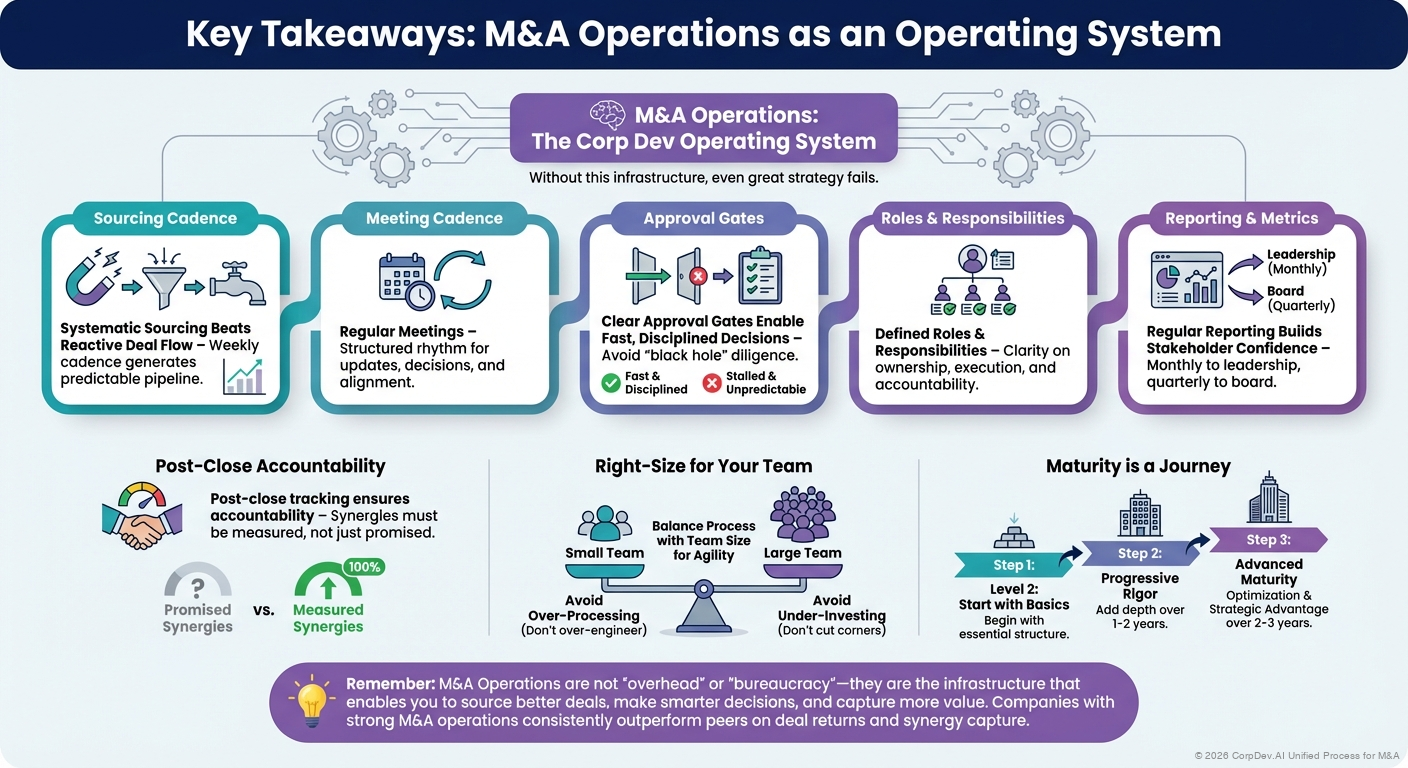
- M&A Operations are the operating system for your corp dev function—without them, even great strategy fails
- Five pillars: Sourcing Cadence, Meeting Cadence, Approval Gates, Roles & Responsibilities, Reporting & Metrics
- Systematic sourcing beats reactive deal flow—weekly cadence generates predictable pipeline
- Clear approval gates enable fast, disciplined decisions—avoid "black hole" diligence
- Regular reporting builds stakeholder confidence—monthly to leadership, quarterly to board
- Post-close tracking ensures accountability—synergies must be measured, not just promised
- Right-size for your team - don't over-process with small team, don't under-invest with large team
- Maturity is a journey - start with basics (Level 2), progressively add rigor over 2-3 years
M&A Operations are not "overhead" or "bureaucracy"—they are the infrastructure that enables you to source better deals, make smarter decisions, and capture more value. Companies with strong M&A operations consistently outperform peers on deal returns and synergy capture.
Related Resources
- Sourcing Cadence & Pipeline Management - Systematic deal sourcing playbooks
- Meeting Cadence & Governance - Agendas and best practices for key meetings
- Approval Gates & Investment Process - Stage-gate framework and IC process
- Roles & Responsibilities - RACI matrices for M&A activities
- Reporting & Metrics - Dashboards, KPIs, and tracking
- Board Reporting - What and how to report to the board
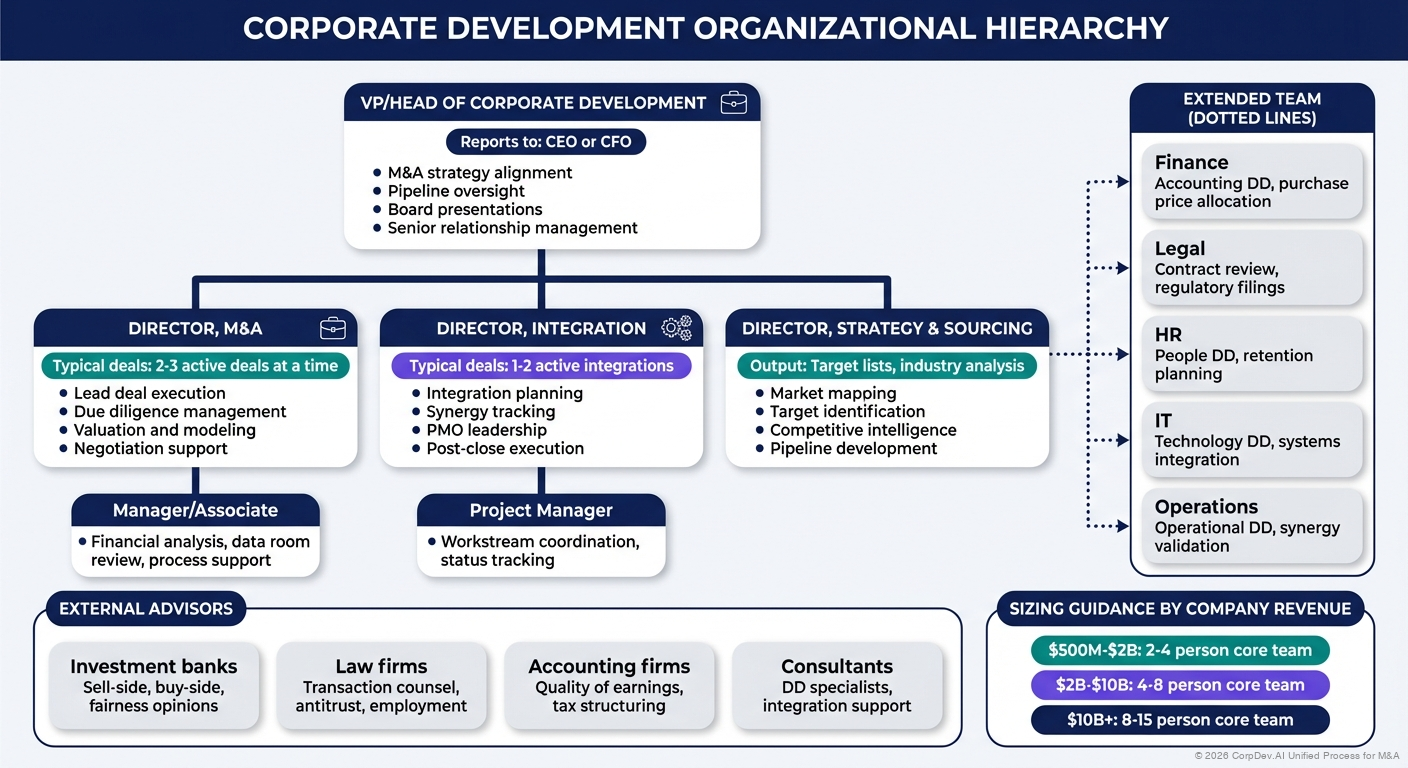
- Corporate Development Team Structure - Organizing your corp dev function
- M&A Strategy Development - Aligning M&A with corporate strategy
© 2026 CorpDev.Ai Unified Process for M&A
Last updated: Thu Oct 30 2025 20:00:00 GMT-0400 (Eastern Daylight Time)