DCF Analysis & Intrinsic Valuation
Discounted Cash Flow (DCF) analysis is the foundation of intrinsic valuation in M&A. This guide covers how to build robust DCF models and apply intrinsic valuation principles to acquisition targets.
What is DCF Analysis?
Definition: DCF analysis values a company based on the present value of its projected future cash flows.
Core Principle: A dollar today is worth more than a dollar tomorrow. DCF discounts future cash flows to their present value using an appropriate discount rate.
When to Use:
- Primary valuation method for mature, stable businesses
- Companies with predictable cash flows
- Long-term hold acquisitions
- Situations where you have good visibility into future performance
When NOT to Use:
- Early-stage companies without revenue
- Highly volatile or unpredictable businesses
- Situations with limited financial information
- Turnaround or distressed situations
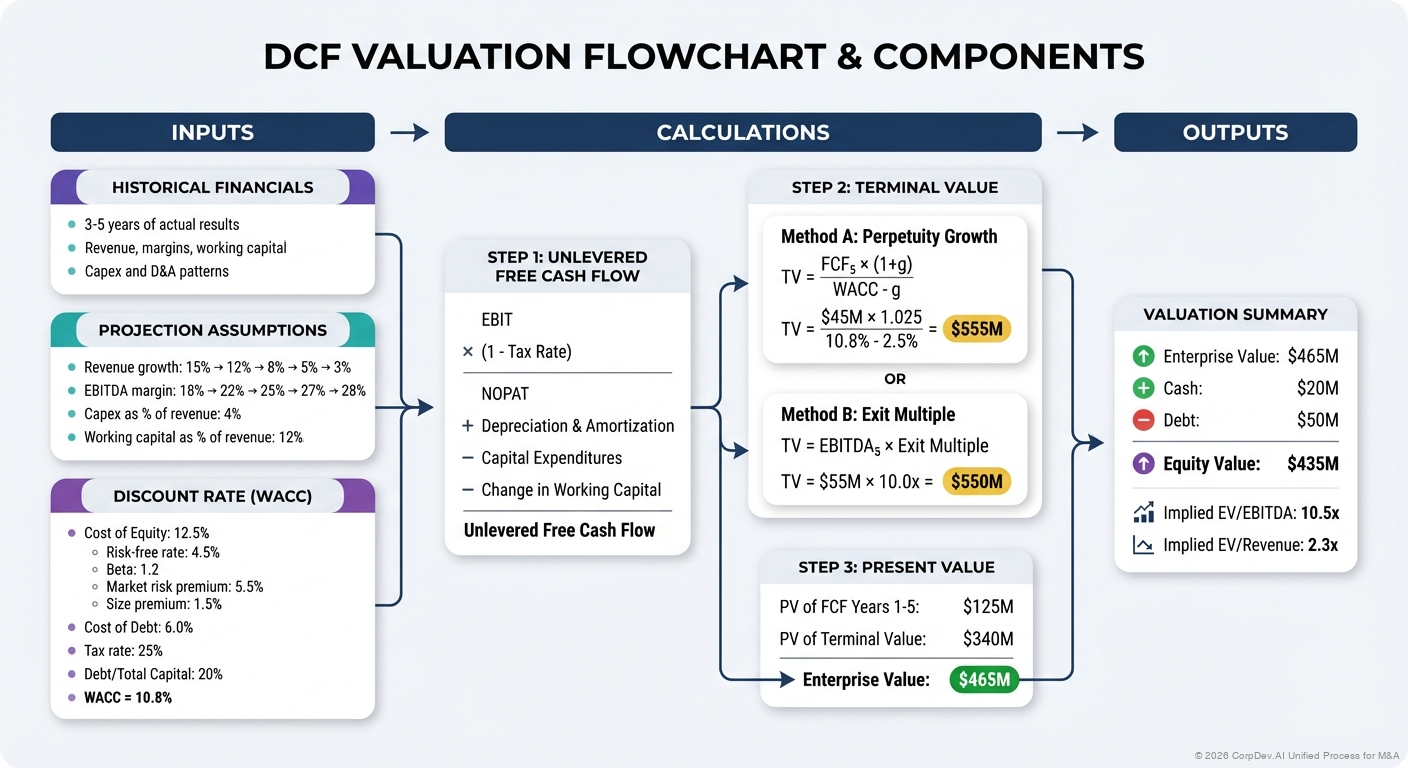
The DCF Formula
Basic Formula:
Enterprise Value = PV of Cash Flows + Terminal Value
                  ────────────────────────────────────
                           (1 + WACC)^n
Components:
- Projection Period: Typically 5-10 years
- Free Cash Flows: Operating cash generated
- Terminal Value: Value beyond projection period
- Discount Rate: Risk-adjusted required return (WACC)
Step-by-Step DCF Process
Step 1: Project Revenue
Approaches:
Top-Down:
- Start with total addressable market (TAM)
- Apply market share assumptions
- Consider market growth rates
- Adjust for competitive dynamics
Bottom-Up:
- Unit economics × volume projections
- Customer cohorts and retention
- Product/service mix analysis
- Pricing trajectory
Hybrid (Recommended):
- Combine both approaches
- Triangulate to reasonable range
- Stress test assumptions
Example Revenue Projection:
Year 1: $50M (historical base)
Year 2: $58M (+16% growth)
Year 3: $68M (+17% growth)
Year 4: $79M (+16% growth)
Year 5: $91M (+15% growth)

Growth drivers:
- Market growing at 12%
- Gaining 2-3% market share annually
- New product launch contributing 5% in Y3-Y5
Step 2: Project Operating Expenses
Cost of Goods Sold (COGS):
- % of revenue (typically 30-70% depending on industry)
- Scale efficiencies over time
- Input cost inflation
- Mix shift impacts
Operating Expenses:
- Sales & Marketing (often 15-30% of revenue)
- R&D (varies widely, 5-25%)
- G&A (typically 10-20% of revenue)
- Model as % of revenue with scale efficiencies
Best Practice: Interview management on unit economics and cost structure
Example:
                Y1    Y2    Y3    Y4    Y5
Revenue        100%  100%  100%  100%  100%
COGS           (45%) (44%) (43%) (42%) (41%)
Gross Margin   55%   56%   57%   58%   59%

S&M            (20%) (19%) (18%) (17%) (16%)
R&D            (10%) (10%) (10%) (9%)  (9%)
G&A            (12%) (11%) (10%) (10%) (9%)

EBITDA Margin  13%   16%   19%   22%   25%
Step 3: Calculate Free Cash Flow
Unlevered Free Cash Flow Formula:
EBIT (Operating Income)
× (1 - Tax Rate)
= NOPAT (Net Operating Profit After Tax)

+ Depreciation & Amortization
- Capital Expenditures
- Increase in Net Working Capital
= Unlevered Free Cash Flow (FCF)
Key Considerations:
Tax Rate:
- Use effective rate, not statutory
- Consider NOL carryforwards
- Factor in international tax planning
- Typical range: 20-30% for US companies
D&A:
- Non-cash charges, add back
- Based on historical % of revenue
- Or detailed capex depreciation schedule
Capital Expenditures:
- Maintenance capex: Keep business running
- Growth capex: Support expansion
- Normalize irregular spending
- Typical range: 2-5% of revenue for asset-light, 10-20% for capital intensive
Net Working Capital:
- Working Capital = (AR + Inventory) - (AP + Accrued Expenses)
- Change in WC = Cash use (increase) or source (decrease)
- Normalize WC as % of revenue
- Watch for seasonality
Example FCF Calculation (Year 1):
EBIT:                          $6.5M
Tax @ 25%:                     ($1.6M)
NOPAT:                         $4.9M

Add: D&A:                      $2.0M
Less: Capex:                   ($2.5M)
Less: Increase in NWC:         ($0.8M)

Unlevered FCF:                 $3.6M
Step 4: Calculate Terminal Value
Terminal Value represents ~60-80% of total DCF value, so get it right!
Method 1: Perpetuity Growth
Formula:
Terminal Value = FCF(n+1) / (WACC - g)

Where:
FCF(n+1) = Free cash flow in first year beyond projection
WACC = Weighted average cost of capital
g = Perpetual growth rate
Selecting Growth Rate (g):
- Never exceed long-term GDP growth (2-3% for US)
- Consider industry maturity
- Typical range: 2.0% - 3.0%
- Conservative: Use 2.5%
Example:
Year 5 FCF: $10M
Growth rate: 2.5%
Year 6 FCF: $10M × 1.025 = $10.25M

WACC: 10%
Terminal Value = $10.25M / (10% - 2.5%) = $136.7M
Method 2: Exit Multiple
Formula:
Terminal Value = EBITDA(n) × Exit Multiple
Selecting Exit Multiple:
- Based on comparable company trading multiples
- Typically use median industry multiple
- Often 8-12x EBITDA for quality businesses
- Consider company maturity at end of projection
Example:
Year 5 EBITDA: $22.7M
Exit Multiple: 10.0x
Terminal Value: $227M
Which Method?
- Use both, compare results
- Perpetuity growth is more theoretical
- Exit multiple is more practical
- Average the two if similar
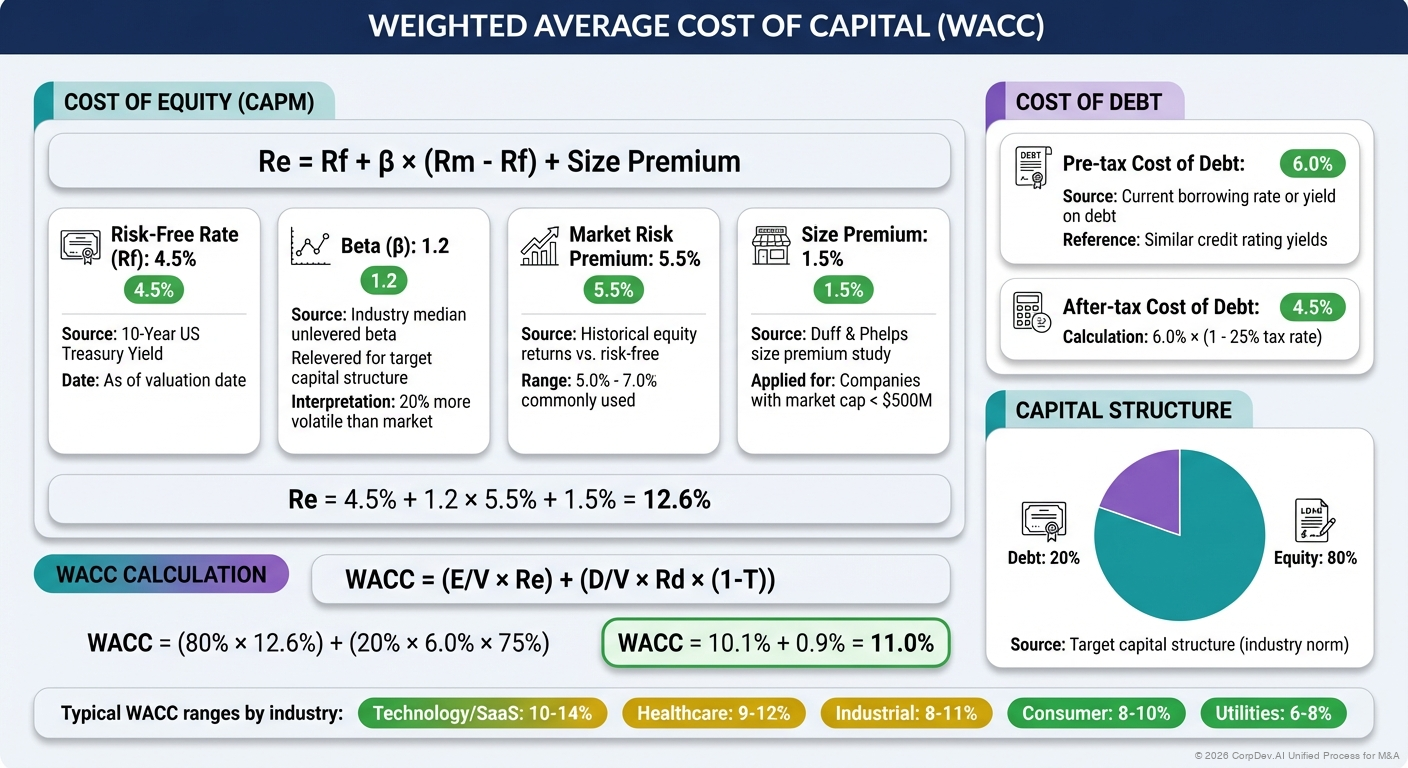
Step 5: Calculate WACC (Discount Rate)
WACC Formula:
WACC = (E/V × Re) + (D/V × Rd × (1 - Tc))

Where:
E = Market value of equity
D = Market value of debt
V = E + D (Total firm value)
Re = Cost of equity
Rd = Cost of debt
Tc = Corporate tax rate
Cost of Equity (Re) - CAPM:
Re = Rf + β × (Rm - Rf) + Size Premium

Where:
Rf = Risk-free rate (10-year Treasury)
β = Beta (systematic risk)
Rm - Rf = Equity risk premium
Component Details:
Risk-Free Rate (Rf):
- Use 10-year US Treasury yield
- Current environment: 3.5% - 4.5%
- Use rate at time of valuation
Beta (β):
- Measure of systematic risk vs. market
- Look up industry beta (Damodaran database)
- Adjust for leverage if needed
- Typical range: 0.8 - 1.3 for most industries
Market Risk Premium (Rm - Rf):
- Historical average: 5-7%
- Common assumption: 5.5% - 6.0%
Size Premium:
- Smaller companies have higher risk
- Add 1-5% for small/mid-cap companies
- Based on company market cap decile
Example Cost of Equity Calculation:
Risk-free rate:           4.0%
Beta:                     1.2
Market risk premium:      5.5%
Size premium:             2.0%

Re = 4.0% + (1.2 × 5.5%) + 2.0% = 12.6%
Cost of Debt (Rd):
- Use current borrowing rate
- Or implied yield on existing debt
- Typical range: 4-8% depending on credit quality
Target Capital Structure:
- Use target debt/equity mix
- Not current capital structure
- Industry norms: 10-30% debt for most
- Acquirer's typical leverage is reasonable
Example WACC Calculation:
Cost of Equity:           12.6%
Cost of Debt:             6.0%
Tax Rate:                 25%
Target D/V:               20%
Target E/V:               80%

WACC = (80% × 12.6%) + (20% × 6.0% × (1 - 25%))
     = 10.1% + 0.9%
     = 11.0%
Step 6: Calculate Present Value
Discount Each Year's Cash Flow:
PV = FCF / (1 + WACC)^n

Where n = year number
Example:
Year 1 FCF: $3.6M / (1.11)^1 = $3.2M
Year 2 FCF: $5.1M / (1.11)^2 = $4.1M
Year 3 FCF: $6.8M / (1.11)^3 = $5.0M
Year 4 FCF: $8.6M / (1.11)^4 = $5.7M
Year 5 FCF: $10.5M / (1.11)^5 = $6.2M

PV of Terminal Value:
$136.7M / (1.11)^5 = $81.2M

Enterprise Value = $24.2M + $81.2M = $105.4M
Step 7: Calculate Equity Value
From Enterprise Value to Equity Value:
Enterprise Value:             $105.4M
+ Cash and Equivalents:       $5.0M
- Total Debt:                 ($10.0M)
- Minority Interests:         $0M
- Preferred Stock:            $0M
= Equity Value:               $100.4M
Per Share Value (if applicable):
Equity Value / Shares Outstanding = Price per Share
$100.4M / 10M shares = $10.04 per share
Complete DCF Example
Target Company: SaaS business with $50M revenue
Revenue Projections:
                Y0      Y1      Y2      Y3      Y4      Y5
Revenue        $50M    $58M    $68M    $79M    $91M    $105M
Growth          -      16%     17%     16%     15%     15%
Margin Projections:
                Y0      Y1      Y2      Y3      Y4      Y5
Gross Margin   70%     71%     72%     73%     74%     75%
EBITDA Margin  10%     13%     16%     19%     22%     25%
Free Cash Flow:
                        Y1      Y2      Y3      Y4      Y5
EBITDA                 $7.5    $10.9   $15.0   $20.0   $26.3
- Taxes @ 25%          (1.9)   (2.7)   (3.8)   (5.0)   (6.6)
+ D&A                   2.3     2.7     3.2     3.6     4.2
- Capex                (2.9)   (3.4)   (4.0)   (4.6)   (5.3)
- Δ NWC                (0.8)   (1.0)   (1.1)   (1.2)   (1.4)

FCF                    $4.2    $6.5    $9.3    $12.8   $17.2
Terminal Value:
Year 6 FCF (2.5% growth): $17.6M
WACC: 11.0%
Terminal Value = $17.6M / (11.0% - 2.5%) = $207.1M
DCF Valuation:
PV of Year 1-5 FCF:        $37.5M
PV of Terminal Value:      $123.0M
Enterprise Value:          $160.5M

+ Cash:                    $8.0M
- Debt:                    ($15.0M)
Equity Value:              $153.5M
Implied Valuation Multiples:
EV / Current Revenue:      3.2x
EV / Year 1 Revenue:       2.8x
EV / Current EBITDA:       32.1x
EV / Year 1 EBITDA:        21.4x
Sensitivity Analysis
Always conduct sensitivity analysis on key assumptions!
Key Variables to Sensitize:
- Revenue growth rate
- EBITDA margin
- WACC (discount rate)
- Terminal growth rate
- Terminal multiple
Example Sensitivity Table (EV in $M):
WACC vs. Terminal Growth Rate:
              Terminal Growth Rate
WACC        2.0%    2.5%    3.0%
9.0%        $185    $198    $214
10.0%       $165    $176    $189
11.0%       $148    $157    $168
12.0%       $133    $141    $150
13.0%       $121    $128    $135
Revenue Growth vs. EBITDA Margin:
               EBITDA Margin (Year 5)
Growth        20%     25%     30%
12%           $130    $145    $160
15%           $145    $161    $177
18%           $162    $179    $196
Common DCF Pitfalls
1. Overly Optimistic Projections
Problem: Hockey stick projections with unrealistic growth
Solution:
- Benchmark against historical performance
- Compare to peer growth rates
- Stress test downside scenarios
- Get management to explain trajectory
2. Terminal Value Dominates
Problem: 90%+ of value in terminal value
Solution:
- Extend projection period
- Re-evaluate growth assumptions
- Consider if business model is truly sustainable
- May indicate overvaluation
3. Circular References in WACC
Problem: WACC depends on capital structure which depends on valuation
Solution:
- Use industry average capital structure
- Or iterate to converge on consistent structure
- Or use acquirer's target capital structure
4. Ignoring Working Capital
Problem: Forgetting working capital impacts cash
Solution:
- Model working capital as % of revenue
- Understand days sales outstanding, inventory turns, etc.
- Growth consumes working capital
5. Inappropriate Discount Rate
Problem: Using wrong risk-adjusted rate
Solution:
- Match risk profile of business
- Consider size premium for small companies
- Use unlevered beta for enterprise value
- Benchmark against comparable companies
6. Not Normalizing One-Time Items
Problem: Non-recurring items distort projections
Solution:
- Adjust for one-time expenses/gains
- Normalize to sustainable run-rate
- Remove acquisition-related costs
7. Double-Counting Synergies
Problem: Including synergies in both DCF and price
Solution:
- DCF should value target standalone
- Pay for synergies separately
- Or clearly mark synergy case separately
Best Practices
1. Build Three Cases
Base Case: Most likely scenario (50% probability)
Upside Case: Optimistic but achievable (25% probability)
Downside Case: Conservative scenario (25% probability)
Probability-Weighted Value:
Expected Value = (50% × Base) + (25% × Upside) + (25% × Downside)
2. Triangulate with Market Approaches
Don't rely solely on DCF:
- Compare to comparable company multiples
- Check against precedent transactions
- Use DCF to inform intrinsic value
- Use multiples for market reality check
3. Detailed Documentation
Document all assumptions:
- Revenue growth drivers and sources
- Margin improvement initiatives
- Capex requirements and timing
- Working capital assumptions
- WACC component calculations
4. Management Validation
Pressure-test your model:
- Review projections with management
- Understand key business drivers
- Validate unit economics
- Test sensitivities with them
5. Use Football Field Valuation
Present range of values:
                    Low     Mid     High
DCF Analysis       $140M   $160M   $180M
Comparable Cos     $145M   $165M   $185M
Precedent Trans    $150M   $170M   $190M

Implied Range:     $145M   $165M   $185M
6. Link to Strategic Value
DCF shows intrinsic value, but consider:
- Strategic value to your company
- Synergy potential
- Competitive dynamics
- Time value of waiting
- Alternative uses of capital
Advanced DCF Topics
Adjusted Present Value (APV)
Alternative to WACC approach:
Formula:
APV = Unlevered Firm Value + PV(Tax Shield) + PV(Other Effects)
When to Use:
- Changing capital structure
- Significant tax shields
- Multiple financing sources
Real Options Valuation
Value of flexibility and strategic options:
- Option to expand
- Option to delay
- Option to abandon
- Platform value for future acquisitions
Monte Carlo Simulation
Model range of outcomes:
- Define probability distributions for key variables
- Run thousands of scenarios
- Generate expected value and confidence intervals
- Understand risk profile
References
© 2026 CorpDev.Ai Unified Process for M&A
Last updated: Wed Jan 29 2025 19:00:00 GMT-0500 (Eastern Standard Time)