
Corporate Development KPIs & Metrics
A CorpDev scorecard has to answer three separate questions. Are we working on the right opportunities? Are we making and carrying out sound investment decisions? Are the businesses we bought delivering the value we used to justify buying them?
Keep the three apart. Deal count, speed to signing, and pipeline size measure activity; they cannot show that value was created. Post-closing results alone cannot show why an outcome happened: the original judgment, the integration work, the market, or a deliberate change of strategy.
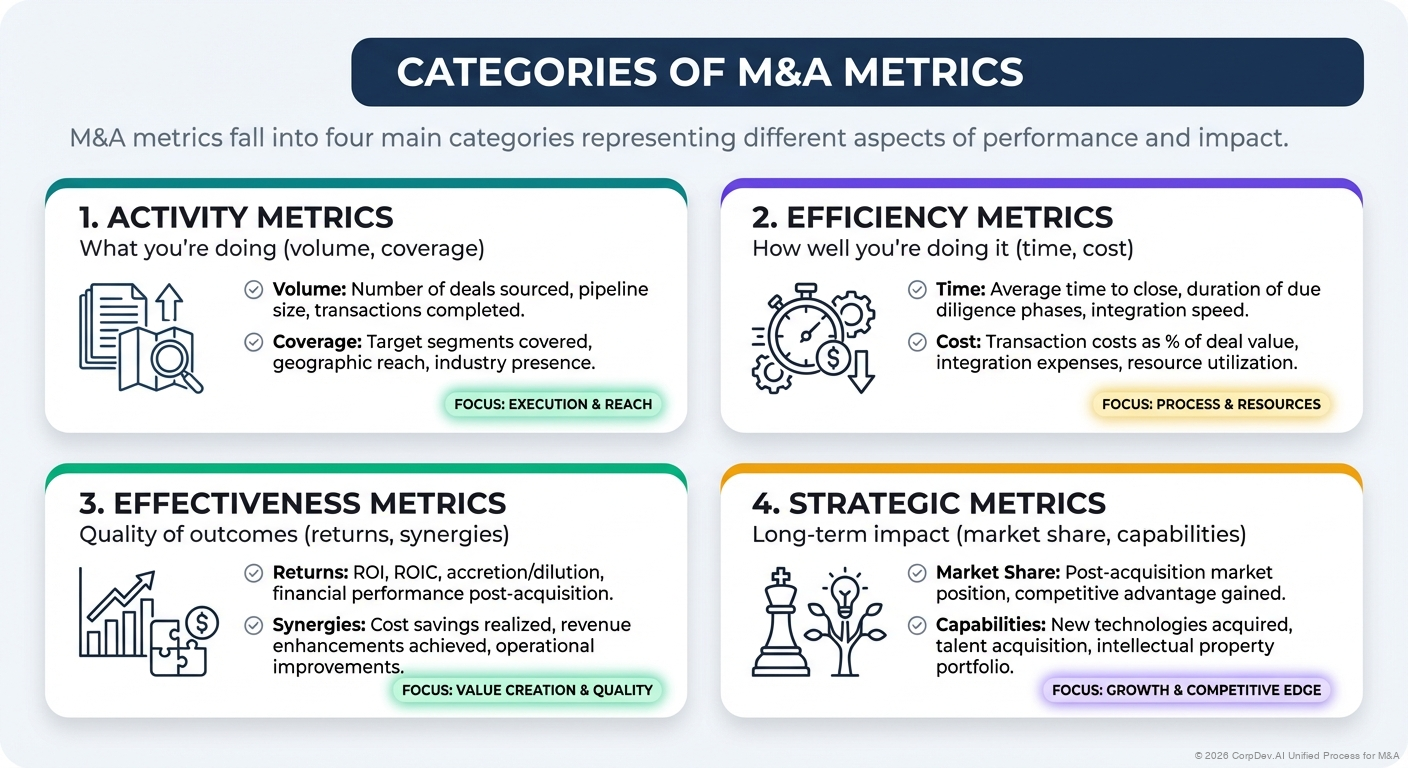 Activity metrics: pipeline and coverage ↗Efficiency metrics: time and cost ↗Effectiveness metrics: buyer economics ↗Strategic metrics: value creation ↗
Start from the decisions the scorecard supports
Each audience uses the scorecard for different decisions. The head of CorpDev allocates team time and improves target selection. The CFO needs a reconciled view of capital committed and economic performance. Business sponsors manage delivery. The board needs to see portfolio exposure, significant departures from approved cases, and where it must step in.
Build one set of definitions and present it differently for each audience. Separate leading indicators from realized results, and show the date each metric runs to. The table pairs each decision with the measure that informs it.
| Decision | Useful measure | Owner |
|---|---|---|
| Where should sourcing effort go? | Coverage and qualified opportunities for each approved thesis | CorpDev |
| Which active work should continue? | Evidence gaps, time in stage, and the resources needed for the next decision | Deal lead |
| Is the investment case changing? | Bridge from the approved assumptions to current expected cash flows | Finance and business sponsor |
| Is integration protecting the business? | Customer retention, service continuity, critical talent, and operational readiness | Business and integration leaders |
| Are the promised benefits real? | Benefits confirmed by finance, net of related costs and dis-synergies | Finance and benefit owner |
| What should change in future deals? | Errors in the original case and execution lessons, by group of deals | CorpDev and finance |
Freeze the approved case at signing
Freeze the investment case approved at signing, and record any changes separately authorized before closing. Keep the assumptions, model version, price, integration costs, timing, and the owner of each value initiative.
After closing, maintain three views: the original approved case, the current operating forecast, and actual results. A revised budget helps run the business; it must never overwrite what the investment promised. When the company deliberately changes the plan, show the decision, its cost, its expected benefit, and who approved it.
Agree in advance how to treat currency movements, acquisitions made by the acquired business, internal transfers, accounting policy changes, and reorganizations. Otherwise the scorecard can report improvements that come only from changing what is measured.
Recover the approved numbers from the original papers
Look-backs often stall at the first step. The approved case for a deal closed four years ago sits in a committee memo, a board paper, and a model saved somewhere. The figures in today's budget have been restated since. Compare actuals with the latest plan and a deal can look on track only because its plan was quietly rebased.
Return to the papers leadership actually approved. Record each figure, its period, the approving document, and its page reference. Keep later revisions separate from the original baseline.
An abridged, hypothetical look-back. The approved column comes from the original papers; finance fills in the actual column and calculates the variance.
| Deal | Figure | Approved case (source) | Actual | Variance |
|---|---|---|---|---|
| Deal A | Year-3 cost synergies, run-rate | 18 (board paper, p. 7) | 11 | (7) |
| Deal A | Cumulative integration costs | 9 (committee memo, p. 12) | 15 | (6) |
| Deal B | Year-2 revenue | 128 (revised appendix, approved after the memo's 140) | 131 | 3 |
| Deal C | Revenue synergies | Not found; memo says only "significant cross-selling" | — | — |
Amounts are illustrative units. The approved column becomes the frozen baseline the company should have kept, and every row carries a source a director can check. The check that matters is basis. A run-rate synergy set against an in-year result shows a gap that is only timing, so confirm each row's basis before anyone explains a variance. "Not found" rows are findings in their own right. They show a benefit the board approved without anyone writing down its size.
Measure what the buyer actually keeps
Use one test, on a consistent valuation basis:
Value to the buyer = standalone value acquired + present value of the benefits only the buyer creates − price paid − present value of transaction and integration costs.
If the price exceeds standalone value, the premium uses up part of the benefits. That is why "synergies created" and "value kept by the buyer" are different measures.
A return analysis should include each relevant cash outflow and inflow on its actual or forecast date. Separate returns on the whole business from returns to shareholders, and explain the financing assumptions. Show how sensitive the return is to terminal value, because much of a modeled return can depend on value beyond the forecast period.
Never average individual deal IRRs to describe portfolio performance. Where it makes sense, calculate one portfolio return from the combined, consistently defined, dated cash flows, and disclose how unrealized investments are treated. Also show investment size, net present value, and cash returned, so one rate cannot hide scale or timing. When cash flows switch between negative and positive more than once, the IRR can be ambiguous; use NPV and the cash-flow detail to explain the economics.
EPS accretion, revenue growth, and accounting goodwill each answer a different question from economic value creation. Use each for its own question, and keep a separate cash-flow assessment of the investment.
Track each benefit in a ledger finance can check
Every significant benefit needs:
- A baseline and a mechanism: how the benefit will happen
- An owner and expected timing
- The cost to achieve it and its dependencies
- The evidence finance will accept
Keep three numbers apart: recurring run-rate, the effect on this period's earnings, and cash actually received. A cost reduction made in December can show a large annualized run-rate and almost no benefit in this year's results.
For revenue benefits, measure the extra contribution after delivery costs, selling costs, cannibalization, and any required investment. Signed cross-selling opportunities are not realized revenue. For cost benefits, count only spending that has actually gone, not spending moved to another cost center. Never count a purchasing saving twice, once in procurement and again in the margin of the product it affects.
This hypothetical bridge shows why the three numbers must stay apart:
| Item | Illustrative amount |
|---|---|
| Annualized gross cost reduction implemented | 12 |
| Replacement operating costs | (3) |
| Annualized net recurring benefit | 9 |
| Current-period recurring benefit, reflecting timing | 4 |
| Current-period implementation cash spend | (6) |
| Current-period net cash effect, assuming benefit equals cash here | (2) |
Amounts are illustrative units, not benchmarks. In a real report, reconcile taxes, working capital, accruals, and capitalized spending separately. The annualized benefit can be positive while this period's cash effect is negative.
Define pipeline and speed metrics before reporting them
For conversion rates, specify the starting group of opportunities, what each stage means, the observation window, and how paused or withdrawn opportunities count. For cycle time, define the start and end events and show the spread of results, not only the average. Separate time the buyer controls from time spent waiting on the seller, regulators, lenders, or others.
Judge adviser spending and internal effort against the deal's complexity and what the team learned. The cheapest process is not always the best one. Track whether critical questions were answered before commitments were made, whether approvals needed avoidable rework, and whether findings reached the model and the contract.
Specify every metric the same way
Write this specification for each scorecard measure:
- Question: Which decision does it inform?
- Definition: Formula, units, population, exclusions, and reporting date.
- Baseline: Approved plan or comparison period, including the model version.
- Source: System, ledger, or evidence file, and how often it refreshes.
- Owner: Who is responsible for the result, and who checks the calculation.
- Interpretation: What can move the number without real performance changing?
- Action rule: Which variance triggers an investigation or a leadership decision?
Set targets from the company's strategy, risk tolerance, and its own deal history. Generic completion rates, synergy percentages, or days-to-close targets prove nothing about how well the function is run.
Turn each variance into a decision
When results diverge from the case, separate five causes: a wrong thesis, the price paid, weak execution, outside change, and measurement effects. Ask what action improves the result now, and what should change in future investment cases. Record both, without claiming precision where the cause is uncertain.
The board should see significant deviations, their cash and strategic effects, recovery actions, and the decisions it must take. A scorecard that shows every acquisition as green has failed if it hides a deteriorating investment case.
Continue with reporting and metrics, board reporting, and value creation planning.
© 2026 CorpDev.Ai Unified Process for M&A