
M&A Valuation Methods Overview
Valuation answers three questions. What is the target worth on its own? What does the market pay for similar businesses? And how much more is the target worth to you, after the cost of creating that extra value? The answers tell a deal team whether to pursue the deal, what to offer, and which assumptions need proof first.
Keep three numbers apart from the start: what the business is worth, the price it will take to buy it, and the most you are authorized to pay. They can differ widely.
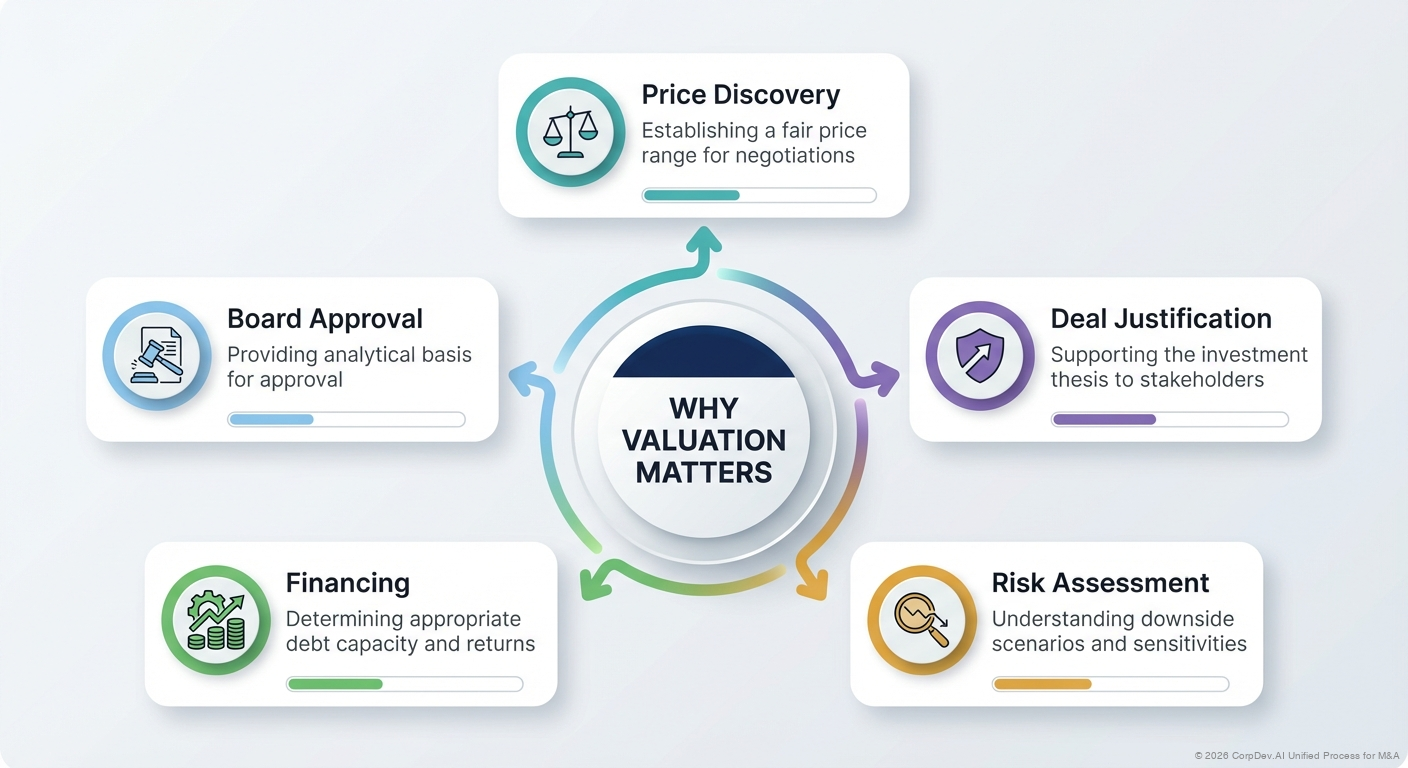 Price discovery and negotiating mandate ↗Deal justification and the investment thesis ↗Risk assessment and downside ↗Financing and corporate consequences ↗Board-ready valuation ↗Choose valuation methods ↗
Define exactly what you are valuing
Before choosing any method, write down:
- The business or assets being valued, and the interest being bought: all of it, a minority stake, or selected assets
- Whether the answer is enterprise value or equity value
- The valuation date, the currency, and the cutoff date for information
- What the valuation will be used for
The perimeter you value must match the perimeter you diligence and the one in the draft agreement. A carve-out forecast that relies on services the seller keeps must include the cost of replacing them. A minority stake with limited rights is not simply a proportional slice of a control price.
Pick the methods that answer your questions
Each method answers a different question. The table shows what each one tells you and where it breaks down.
| Method | What it tells you | Where it is useful | Main weakness |
|---|---|---|---|
| Discounted cash flow | The value of forecast cash flows, at a rate that reflects their risk | Businesses whose volumes, prices, costs, and reinvestment can be forecast with evidence | Very sensitive to assumptions, especially the terminal value |
| Trading comparables | How the stock market prices companies with similar economics | Targets with a credible set of listed peers and comparable metrics | Listed peers may differ in growth, risk, scale, or business mix |
| Precedent transactions | What specific buyers paid in specific past deals | Understanding deal pricing and buyer behavior | Terms, timing, synergies, and disclosure are often incomplete |
| Asset or sum-of-the-parts analysis | The value of separable assets or business units | Diversified groups, asset-heavy businesses, or separation decisions | Must account for liabilities, taxes, separation costs, and links between the parts |
| Scenario or milestone analysis | Value under distinct technical, regulatory, or commercial outcomes | Early-stage assets and all-or-nothing risks | Probabilities and the economics of each outcome need specialist evidence |
Use several methods only when each answers a separate question. Three valuations built on one unsupported forecast are one opinion, not three. Damodaran's valuation materials set out the difference between cash-flow, relative, and option-based approaches.
Clean up the earnings before you value them
Reconcile reported revenue, earnings, working capital, and cash flow to the source documents. Then sort each adjustment into one of four groups: accounting corrections, truly one-time items, run-rate changes, and synergies only this buyer would capture.
Record each adjustment's description, period, amount, source, owner, and rationale. Add evidence that the cost will not recur, or that the promised change can actually be made. Calling a cost exceptional does not remove it. If similar "one-time" costs appear every year, adding them all back overstates the earnings the business can sustain.
For a carve-out, bridge the allocated results to the costs the business will carry on its own. For a fast-growing business, remember that contracted revenue, annual recurring revenue, recognized revenue, bookings, and cash collected are different numbers. Use the one the valuation needs.
Match each multiple to the right earnings measure
Divide enterprise value by measures earned before financing, such as revenue, EBITDA, or EBIT. Divide equity value by measures that belong to shareholders, such as net income. Use the same periods and definitions for every peer and for the target. Damodaran's explanation of multiples covers this rule and the growth, risk, and cash-flow drivers behind every multiple.
Never apply a generic "software multiple" or "industrial discount" without a dated, relevant sample behind it. Explain why each peer is comparable and why the target sits where you place it in the range.
Bridge from enterprise value to equity value
Enterprise value is the value of the operating business. Equity value is what remains for shareholders after other claims.
Illustrative example, in millions:
Value of operating business                    500
Add: excess cash not already counted             20
Add: nonoperating investment valued separately   10
Less: debt and other relevant claims            100
Illustrative equity value                      430
The right bridge depends on the business and the valuation convention. Settle leases, pension deficits, noncontrolling interests, preferred shares, and tax exposures with finance and advisers. Then reconcile the bridge with the definitions in the purchase agreement. "Debt-free, cash-free" is a label, not a calculation.
Keep synergies out of standalone value
A buyer may sell through its own channels, remove duplicate costs, speed up product development, or change how the business runs. Each benefit needs a baseline, owner, timing, investment, and risk assessment, plus any offsetting losses the deal causes (dis-synergies).
Illustrative acquisition economics: Standalone enterprise value is $500 million. The benefits only this buyer can create have a present value of $90 million. Integration costs and dis-synergies have a present value of $35 million. At an enterprise purchase price of $530 million, the simplified surplus to the buyer is $25 million:
$500m + $90m − $35m − $530m = $25m
On these numbers the buyer would break even at $555 million, but that is no reason to pay it. The buyer still needs a margin for uncertainty and a comparison with other uses of the capital. Before relying on the result, check that transaction costs and taxes sit in the right components.
Treat a premium as a measurement, not a source of value
A premium to the unaffected share price measures the gap between an offer and a market price on a defined date. It creates no value by itself. A control premium, a strategic premium, and synergy value can describe the same benefit, so adding all three can count it several times.
Ask what control lets you change and how that change shows up in cash flow. If you cannot explain the economics, a percentage premium will not fill the gap.
Explain why the methods disagree before combining them
When the DCF, trading comparables, and precedent transactions disagree, find out why. The cause is usually different growth assumptions, market dates, control rights, business mix, or synergy expectations.
A football field is the chart that sets each method's range side by side. Label each bar with the method, valuation date, metric period, key assumptions, and whether it shows enterprise value or equity value. Explain exclusions and outliers. Never average unrelated methods to reach a convenient midpoint.
Ask what each range quietly assumes
A football field hides the most useful fact on the page: why each bar sits where it does. A DCF above the trading comparables usually means the forecast assumes growth the market is not pricing into the peers. Precedents above both usually mean past buyers paid for control and synergies, or bought in a different market. Once those reasons are visible, the debate moves from "which number is right?" to "which assumption do we believe?"
Read the supporting forecasts, peer set, and transaction evidence together. State the assumptions that explain each range before proposing any weighting.
A hypothetical example, enterprise value in millions:
| Method and range | What it quietly assumes | Evidence that settles it |
|---|---|---|
| DCF, $460–540 | Revenue grows 12% a year for five years; margins rise from 18% to 23% | The target's actual growth and margins over the last three years |
| Trading comparables, $380–450 | Growth close to the peers' 6% consensus; a minority interest in a listed company, priced today | Whether any peer has the target's customer mix |
| Precedents, $560–650 | Control and cost synergies, priced by buyers in a stronger market two to four years ago | Which precedent buyers had overlapping operations to cut |
The excerpt turns a debate about weights into two questions of fact. Can the business grow twice as fast as its peers? Would this buyer capture synergies the way past buyers did? Settle both, with a named owner for each, before the range goes to committee. The one check that matters: trace each figure back to the cell or row it came from, and confirm it supports the assumption written beside it. A misread input sends the team off to test the wrong assumption.
Set the negotiating range before talks begin
The investment paper sets four points: the opening indication, the outcome you are aiming for, the price that requires fresh approval, and the walk-away economics. Name the evidence or terms that could move the range, such as customer retention, confirmed IP rights, financing, remedies, working capital, or integration scope.
Keep a table of returns at each price and a log of every concession. Revisit value when new information changes the case, not only when the seller changes its price.
Give the committee a package it can challenge
The committee package contains:
- The normalized financial base and the methods chosen
- The valuation range and the bridge from enterprise value to equity value
- The synergy and cost schedule
- Downside scenarios
- The recommendation
Name the few assumptions that matter most and the work still needed to settle them.
After approval, keep the model and its assumptions as the underwriting baseline. Judge later performance against what the company approved, not against a revised forecast that has dropped the original promise.
Continue with DCF analysis, trading comparables, precedent transactions, and merger modeling.
© 2026 CorpDev.Ai Unified Process for M&A