
Comparable Company Analysis
Trading comparables show how the stock market prices businesses like your target on a given date. They are useful evidence in an acquisition valuation, but they cannot tell you what a different company is worth or what a buyer should pay for control.
The hard part is choosing the peers and putting their numbers on the same basis. Anyone can calculate a median. The analysis earns trust when it explains why each peer belongs in the sample.
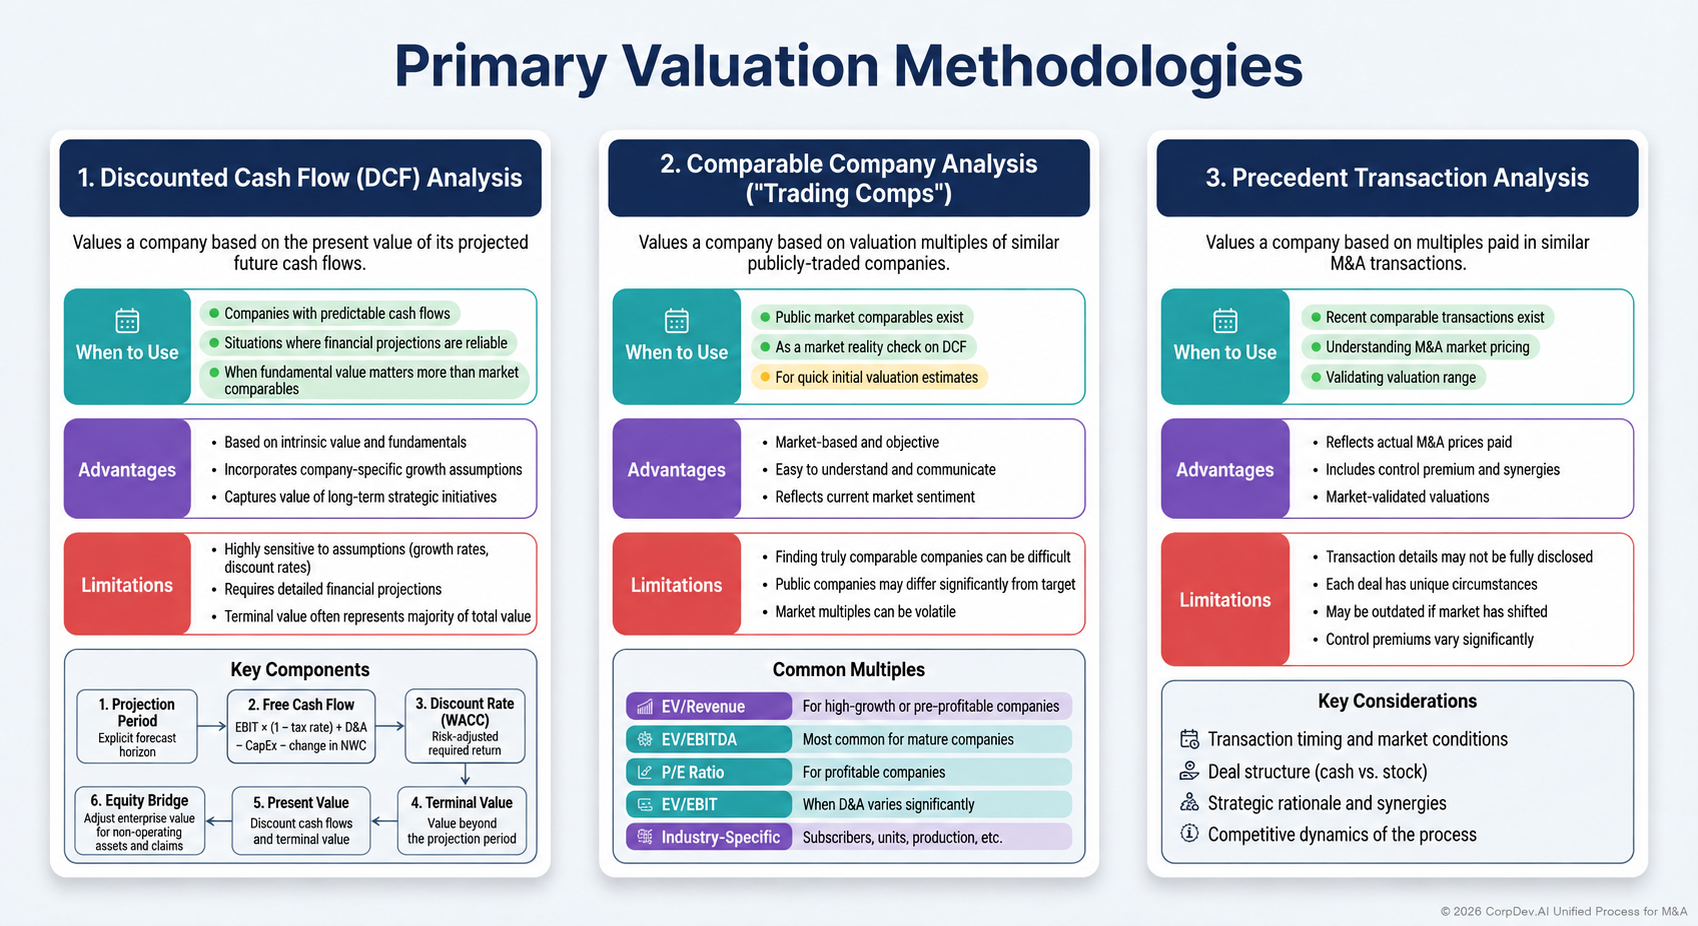 Discounted cash flow ↗Discounted cash flow: when to use ↗Discounted cash flow: strengths ↗Discounted cash flow: limitations ↗Comparable company analysis ↗Comparable company analysis: when to use ↗Comparable company analysis: strengths ↗Comparable company analysis: limitations ↗Precedent transactions ↗Precedent transactions: when to use ↗Precedent transactions: strengths ↗Precedent transactions: limitations ↗DCF projection period ↗DCF free cash flow ↗DCF discount rate ↗DCF equity bridge ↗DCF present value ↗DCF terminal value ↗EV / revenue ↗EV / EBITDA ↗Price / earnings ↗EV / EBIT ↗Industry-specific multiples ↗Transaction timing and market conditions ↗Deal structure ↗Strategic rationale and synergies ↗Competitive dynamics of the process ↗
Text links for this illustration
- Discounted cash flow
- Discounted cash flow: when to use
- Discounted cash flow: strengths
- Discounted cash flow: limitations
- Comparable company analysis
- Comparable company analysis: when to use
- Comparable company analysis: strengths
- Comparable company analysis: limitations
- Precedent transactions
- Precedent transactions: when to use
- Precedent transactions: strengths
- Precedent transactions: limitations
- DCF projection period
- DCF free cash flow
- DCF discount rate
- DCF equity bridge
- DCF present value
- DCF terminal value
- EV / revenue
- EV / EBITDA
- Price / earnings
- EV / EBIT
- Industry-specific multiples
- Transaction timing and market conditions
- Deal structure
- Strategic rationale and synergies
- Competitive dynamics of the process
Decide what makes a peer comparable before you look at multiples
Write the selection criteria before you pick any companies. Start with how the target makes money: its customers, products, delivery model, contract structure, geography, growth, profitability, capital intensity, and risk. Industry labels are too broad on their own.
Keep a close peer group with genuinely similar economics and a broader group for context. A short, relevant list is more useful than a long one that mixes incompatible business models. Record which companies you excluded and why.
The table shows the questions that decide comparability and where to find the answers.
| Dimension | Question | Evidence |
|---|---|---|
| Revenue model | Subscription, usage, project, product, or transaction fees? | Segment reporting and revenue recognition policies |
| Customers | Same buyer, budget, concentration, and buying cycle? | Customer and end-market disclosures |
| Growth | Organic, from acquisitions, a cyclical recovery, or price increases? | Growth bridge and management reporting |
| Margins | Similar product mix, scale, and cost structure? | Gross and operating margin analysis |
| Reinvestment | Similar capital spending and working-capital needs? | Cash-flow statements and operating data |
| Risk | Similar retention, regulation, leverage, and volatility? | Filings, contracts, risk disclosures, and specialist input |
Read the segment notes before trusting a peer's multiple
A peer's multiple prices the whole company. If 45% of a "software" peer's revenue comes from hardware resale, its EV/EBITDA blends two businesses. Company descriptions and industry codes hide this; the annual report shows it. Listed companies reporting under IFRS or US GAAP must give a profit measure for each reportable segment, and usually its revenue (IFRS 8 and ASC 280). When one segment mixes activities, the revenue note often breaks revenue down further.
Read the segment notes before admitting a company to the close peer group. Record which activities match the target and which make the consolidated multiple less comparable.
A hypothetical example covering three candidate peers:
| Peer | Revenue that matches the target | Other revenue inside its multiple | What the team decides |
|---|---|---|---|
| Delta | 90% | Equipment installation, 10% | Keep in the close peer group |
| Epsilon | 55% | Hardware resale, 45%, at a much lower segment margin | Move to the context group; its multiple blends two businesses |
| Zeta | 80% | Consulting, 20% | Keep, and show the mix in the peer table |
Record each decision and its page reference in the exclusion log. Then compute the multiples in the workbook from the filings, not from a data vendor's summary. The one check that matters is the profit measure. Each company defines segment profit its own way, often before corporate costs, so segment figures rarely add up to consolidated EBITDA. Compare segment margins across peers only after you confirm the definitions match.
Price every peer on the same date
Use one market-data date and one information cutoff. Record the share price, diluted share count method, debt, cash, preferred claims, and noncontrolling interests as they apply. Adjust for large changes since the latest balance sheet, such as acquisitions, capital raises, or debt repayments.
Never combine today's share price with balance-sheet figures that would misstate today's enterprise value. If you cannot support an adjustment, disclose the limitation and consider dropping that peer from the main sample.
For US-listed peers, filings on SEC EDGAR are the primary source for reported financial statements and transaction disclosures. Record the actual filing and period in the model, not only a data vendor's homepage.
Divide each value by the matching earnings measure
Enterprise-value multiples divide by operating measures earned before financing, such as revenue, EBITDA, or EBIT. Equity-value multiples divide by measures that belong to shareholders, such as earnings attributable to common shareholders. Use the same definitions for every peer and for the target. Damodaran's discussion of multiples explains this matching rule.
Every multiple carries hidden assumptions. EV/EBITDA does not remove differences in capital intensity or tax. A revenue multiple assumes something about the margins and reinvestment the business will eventually reach. If the target loses money, back a revenue multiple with evidence of a path to sustainable cash generation.
Financial institutions may need equity-based measures, because financing and regulatory capital are part of how they operate. Choose the multiple that fits the economics rather than forcing every business into EV/EBITDA.
Put every peer on the same twelve months
State whether each figure covers the last twelve months (LTM), the next twelve months, or a fiscal year. Calendarize peers with different year-ends so every figure covers the same months. Date each forecast and say whether it comes from consensus, company guidance, or your own assumptions.
A practical LTM bridge:
LTM = Latest full fiscal year + current year-to-date − same year-to-date period last year
Check that acquisitions, discontinued operations, accounting changes, and period lengths do not break this simple bridge. If a peer recently bought a business, that business is in its enterprise value, so its earnings must be treated the same way.
Show reported and adjusted figures side by side. For each adjustment, record the source, rationale, amount, and whether the target gets the same treatment. Inconsistent conventions most often distort stock-based compensation, leases, restructuring, and capitalized development costs.
Build a table that explains the spread in multiples
A column of multiples explains nothing on its own. Add growth, margins, cash conversion or capital intensity, and the main business differences. Mark negative or near-zero denominators as "not meaningful" so extreme ratios cannot dominate an average.
Illustrative peer set; fictional companies and figures:
| Company | Enterprise value | LTM EBITDA | EV/EBITDA | Organic revenue growth | EBITDA margin |
|---|---|---|---|---|---|
| Alpha | $600m | $60m | 10.0× | 5% | 20% |
| Beta | $960m | $80m | 12.0× | 9% | 25% |
| Gamma | $1,260m | $90m | 14.0× | 14% | 30% |
The median is 12.0×. That does not make 12.0× right for a target with weaker retention, lower margins, and a less proven forecast. Read across the rows: the multiple rises with growth and margin. The table raises the question of what drives the spread; your analysis has to answer it.
Choose a range you can defend
Explain where the selected range sits relative to the peer evidence, and why the target's economics put it there. Never add fixed increments for growth or subtract a standard percentage for private ownership without analysis behind it.
Illustrative application: At 10–12× normalized EBITDA of $25 million, implied enterprise value is $250–300 million. With $10 million of excess cash and $40 million of debt, the simplified equity range is $220–270 million, before other claims or adjustments.
Show the selected range separately from the observed low, median, and high. If the target falls outside the peer range, explain why and cross-check the conclusion against a DCF or another suitable method.
Analyze size and control instead of applying set discounts
Smaller companies can differ in customer concentration, management depth, access to funding, and resilience. Analyze those differences instead of applying a standard "small-company discount." In a control acquisition, the lack of a quoted share price is no reason, on its own, for any particular percentage cut.
Likewise, never add a control premium mechanically to a trading multiple. Identify what the buyer can actually change in the business. Then count each benefit once: in the selected multiple, in a premium, or in a separate synergy valuation.
Use regression to explore, not to prove
Regression can show how multiples vary with growth, margins, and other characteristics. It cannot rescue a weak sample or prove cause and effect. Check the sample size, outliers, correlated variables, the measurement date, and whether the target falls outside the range of the data.
Present a regression as supporting analysis and state its limits. A formula with precise coefficients creates false confidence when the underlying businesses are not comparable.
Give reviewers everything they need to redo the work
The review package should contain:
- The inclusion criteria and peer profiles
- Source records and enterprise-value calculations
- Financial adjustments for each peer
- The observed statistics and the selected range
- The target's bridge from enterprise value to equity value
Include sensitivities to the target's earnings figure as well as to the multiple.
Ask an independent reviewer to choose peers without seeing the preferred valuation. The differences between the two selections show where judgment is driving the answer, and where the team may have anchored on a number.
Keep the analysis current through negotiation
Refresh share prices and important disclosures before any consequential decision. Keep earlier versions so the team can tell market movement from changed assumptions. If the seller uses a different peer set or metric, reconcile the definitions before debating the answer.
Continue with precedent transactions, DCF analysis, and valuation quality review.
© 2026 CorpDev.Ai Unified Process for M&A