
M&A Reporting & Metrics
M&A reporting should tell management three things: where to spend attention, which commitments are at risk, and whether acquisitions are delivering what was promised when they were approved. Counts and ratios help only when their definitions stay stable and someone owns the action they trigger.
Finance and CorpDev should agree how measurement works before the first acquisition enters reporting. Finance owns accounting reconciliation and investment measurement. CorpDev owns pipeline definitions and the investment record. Business leaders own operating results. Integration teams coordinate initiatives, but they should not certify their own financial benefits.
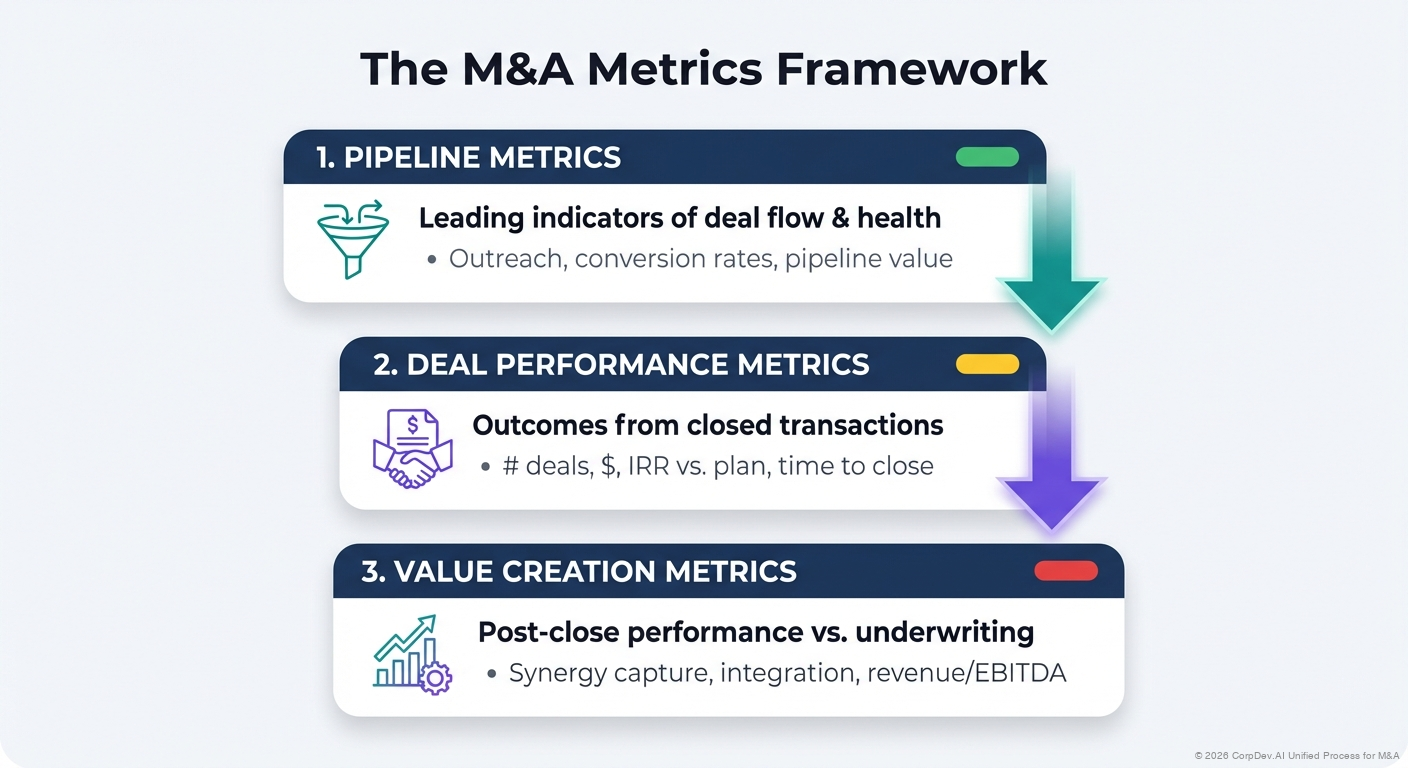 Pipeline metrics and cohort conversion ↗Deal performance and expected versus realized returns ↗Value creation against underwriting ↗
Text links for this illustration
Example dashboards and downloads
Use this fictional monthly pack as a starting point. The workbook contains editable sample records, formulas, a dashboard, a pipeline tracker, a value-creation schedule, and a risk and decision log. Replace the examples with approved company data and tailor the definitions before using it in a live review.
Corporate development review
As of 30 September 2026 · USD millions
September P&L benefit
Same period and definition across all three measures. Before one-time costs to achieve and tax.
Actual versus original plan: (0.8). Review timing and structural causes by initiative.
Opportunity review
Indicative enterprise values are uncommitted. The dashboard does not add them into a purported capital commitment or acquisition forecast.
| Opportunity / sponsor | Stage / status | Next decision | Indicative EV | Evidence to advance |
|---|---|---|---|---|
| Aster ControlsIndustrial President | ScreenActive | 2026-09-25 | 120.0 | Customer overlap analysis pending |
| Beacon WorkflowSoftware President | ExploreActive | 2026-10-05 | 250.0 | Product tests in progress |
| Cedar AnalyticsData President | LOIActive | 2026-09-29 | 420.0 | Revenue bridge under review |
| Delta ServicesServices President | Binding approvalActive | 2026-09-30 | 85.0 | Final consent package pending |
| Elm ComponentsIndustrial President | ScreenActive | 2026-10-12 | 160.0 | Plant visit scheduled |
| Fjord SystemsSoftware President | ExploreActive | 2026-10-08 | Not available | Indicative price not yet discussed |
| Grove LogisticsServices President | ExploreHold | 2026-09-15 | 90.0 | Awaiting sponsor capacity |
| Harbor ToolsIndustrial President | ClosedClosed | Not applicable | 60.0 | Transferred to integration review |
Value-creation review
Incremental operating P&L benefit after recurring delivery costs, before one-time costs to achieve and tax. Plan, actual, and the retained September 15 forecast cover September only. Keep the original plan and the prior forecast visible.
| Initiative / owner | Original plan | Actual P&L | Forecast at 15 Sep | Actual vs plan |
|---|---|---|---|---|
| Procurement contractsProcurement VP | 1.8 | 1.5 | 1.7 | (0.3) |
| Shared-service consolidationOperations VP | 1.0 | 0.9 | 1.0 | (0.1) |
| Cross-sell contributionCommercial VP | 0.8 | 0.6 | 0.7 | (0.2) |
| Hosting optimizationTechnology VP | 0.6 | 0.4 | 0.6 | (0.2) |
| Total September benefit | 4.2 | 3.4 | 4.0 | (0.8) |
Cash and annualized run rate
| Initiative | September gross cash | September cash cost to achieve | September net cash | Exit annual run rate |
|---|---|---|---|---|
| Procurement contracts | 1.2 | 0.3 | 0.9 | 18.0 |
| Shared-service consolidation | 0.8 | 0.2 | 0.6 | 10.8 |
| Cross-sell contribution | 0.4 | 0.3 | 0.1 | 7.2 |
| Hosting optimization | 0.2 | 0.1 | 0.1 | 4.8 |
Cash amounts are before tax. Exit run rate is annualized P&L at the reporting date; it is neither September earnings nor September cash. Retain invoice, payroll, account-contribution and implementation evidence against each initiative.
Risks and decisions requiring ownership
Severity reflects the example deal team's assessment. An item becomes closed only when its evidence and required acceptance are recorded.
| Item / transaction | Owner | Due / status | Evidence / next action |
|---|---|---|---|
| Customer concentration evidenceCedar Analytics · Risk · Critical | Commercial diligence lead | 2026-09-27Open | Largest-customer renewal not confirmedNext: Obtain permitted customer evidence |
| Approve technical diligence scopeBeacon Workflow · Decision · High | CTO | 2026-10-04Open | Scope and budget circulatedNext: Approve scope and named reviewers |
| Contract consent requiredDelta Services · Risk · Critical | General Counsel | 2026-10-02Open | Executed consent not yet receivedNext: Confirm condition disposition |
| Payroll readinessHarbor Tools · Risk · Critical | HR VP | 2026-08-28Closed | Parallel payroll reconciledNext: Closed with evidence retained |
| Select customer interview sampleAster Controls · Decision · Medium | Business sponsor | 2026-09-29Open | Sample proposal awaiting sponsorNext: Confirm permitted sample |
| Fund hosting migration supportJuniper Software · Decision · High | Technology VP | 2026-09-30Open | Revised implementation budget readyNext: Decide resource allocation |
Refresh discipline: fix the reporting date, reconcile source records, preserve prior forecasts, validate benefits with Finance, and close the meeting with decisions, owners and dates. Empty values mean unavailable; confirmed zero values remain zero.
Build three views for three different questions
Each view serves a different decision, so each draws on different evidence.
| View | Question it answers | What it uses |
|---|---|---|
| Pipeline and capacity | What deserves attention, what is waiting, and which resources will be needed? | Stage evidence, relationship status, decision dates, capacity limits |
| Execution | What threatens signing, closing, business continuity, or a value milestone? | Unresolved decisions, critical-path dependencies, approval conditions, funded actions |
| Investment performance | How does the acquired business compare with the original thesis, and what should change? | Standalone performance, validated benefits, implementation costs, updated economics |
Do not blend the three into a single health score. A financially attractive deal held up by a missing consent needs a different action from an on-schedule integration that is losing key customers.
Define every metric before you report it
For each measure, record:
- Definition, unit, and scope
- Dates, source, and calculation
- Owner and review frequency
- How the target was set
- Known limitations
Separate stock measures, such as active opportunities at quarter end, from flow measures, such as new opportunities qualified during the quarter.
The table shows what to settle for the most common measures.
| Measure | Definition to settle | What management uses it for |
|---|---|---|
| Qualified opportunities | Evidence required for entry; the unresearched universe excluded | Judging useful coverage |
| Stage aging | Start and stop dates; how deliberately parked targets are treated | Finding stalled decisions |
| Conversion | Named entry cohort, destination stage, observation window | Improving sourcing and screening |
| Forecast commitment | Amount and timing under explicit scenarios | Planning cash and resources |
| Diligence exceptions | Significant unresolved items by decision deadline | Escalating investment risks |
| Incremental benefit | Result against the agreed comparison case (what would have happened anyway), validated by Finance | Testing value delivery |
| Cost to achieve | Actual and forecast implementation spending | Judging net economics |
| Critical retention | Defined customer or employee group and time window | Protecting the thesis |
Set targets from strategy, operating capacity, earlier cohorts, and risk tolerance. Do not import an arbitrary market benchmark and treat it as a company objective.
Measure pipeline conversion by cohort
Measure conversion for a fixed group of targets followed over time. In this hypothetical example, 40 targets were qualified in the first quarter. By year end, their outcomes look like this:
| Q1 cohort, observed at year end | Targets |
|---|---|
| Reached LOI | 6 |
| Declined | 10 |
| Still in research or relationship development | 24 |
| Qualified in Q1 | 40 |
Six LOIs out of 40 qualified targets is 15% observed conversion to date. It is not the final conversion rate for the cohort, because 24 targets are still open. Report the outcomes together with the observation date.
Do not divide this quarter's closings by this quarter's new targets when the deals started years apart. Report inbound, outbound, and adviser-led channels separately where their starting points differ. Track the reasons for declines and deferrals, not just the counts.
A long relationship period can be appropriate. Separate time spent waiting for a seller's trigger from time spent waiting for an internal decision; only the second necessarily signals avoidable delay.
Lock the approval baseline and keep it visible
At approval, lock the model, assumptions, forecast periods, investment basis, currency convention, expected benefits, costs, and strategic milestones. Keep this original case even after the business adopts a new annual budget.
Report three columns: the original approved case, actual results to date, and the current forecast. Explain the differences with a bridge that separates:
- Standalone operating variance
- Changes in scope or in what was acquired
- Foreign exchange and accounting policy effects
- Additional revenue and cost benefits
- Timing differences versus permanent shortfalls
- Implementation costs, and continuing costs the original plan left out
A rebased forecast helps manage the business. It should never erase what the investment promised.
Never add run-rate, profit, and cash benefits together
One cost initiative can have three valid measures: annualized run-rate savings, profit benefit in the period, and cash benefit. They answer different questions and must never be added together.
In a hypothetical example, a vendor change takes effect on October 1 and cuts recurring expense by $100,000 a month. At December 31 the three measures read:
| Measure | Amount | What it answers |
|---|---|---|
| Annualized run rate at year end | $1.2 million | What the saving is worth per year from now on |
| October–December profit benefit | $300,000, before implementation costs | What the saving added to this year's results |
| Cash benefit | Depends on invoice and payment timing | What the saving added to cash |
Report all three separately when that is useful.
For revenue initiatives, report the additional revenue and the contribution or cash flow it produces after commissions, delivery costs, cannibalization, investment, and working capital. Revenue is not interchangeable with EBITDA savings. Give overlapping initiatives a single benefit owner so the same benefit is not counted twice.
Label forecast-based returns as expected, not realized
While the company still owns an acquisition, its life-to-date cash flows are observable. A full investment IRR, however, generally needs assumptions about remaining cash flows or residual value. When the figure includes forecasts, call it "updated expected IRR" and disclose the valuation date, the remaining forecast, the terminal value method, and the investment basis.
Do not average individual deal IRRs to get a portfolio return. If a portfolio IRR is useful, Finance should calculate it from the combined, dated cash flows of the investments, with one consistent residual-value method and disclosed assumptions. Show significant deals individually as well, because a portfolio number can hide a failed thesis.
For return on invested capital (ROIC), agree the numerator, the acquisition capital in the denominator, the treatment of goodwill, additional investment, and the measurement period. Keep purchase-accounting effects and adjusted measures transparent. EPS accretion is a separate reporting consequence and does not show that value was created.
Review each investment on one scorecard
Use the same scorecard for every acquisition, so reviews are comparable across deals and years.
INVESTMENT REVIEW (deal / approval date / reporting date)
Business owner / Finance validator:
Original thesis and measurable milestones:
Metric                              Approved case   Actual to date   Current forecast
Standalone revenue / profit:
Additional revenue benefit:
Additional profit benefit:
Cost savings, profit in the period:
Cost savings, run rate at period end:
Cash benefit and cash costs:
Total cost to achieve:
Critical customer and employee outcomes:
Updated expected returns, and residual-value assumptions:
Variance bridge: timing / structural / scope / FX / accounting:
Three decisions required, with owners and dates:
Use one reporting cut-off across the scorecard. Mark missing information as unavailable; a blank cell must never be read as zero.
Before the pack goes out, check it for four errors:
- An undisclosed change in scope, period, currency, denominator, or definition
- Run-rate savings presented as period profit or cash
- Forecast returns labeled as realized
- A portfolio return built by averaging deal IRRs
Explain variances from initiative logs, never recompute them
Monthly commentary needs an evidenced explanation. If procurement is behind plan, identify the delayed contract, decision, or implementation step. Leave a variance unexplained when the records do not establish its cause.
The workbook calculates each variance. The initiative owner explains it from supplier notes, payroll records, and project updates. Keep calculated amounts separate from interpretations of their cause.
In the sample pack at the top of this page, September's benefit was $3.4 million against a $4.2 million plan. The 15 September forecast was $4.0 million, so $0.6 million of the $0.8 million shortfall was not yet visible at mid-month. Commentary should explain both gaps.
Useful commentary is short and leaves the gaps visible. In this abridged excerpt the variances come from the sample workbook, and the log entries are hypothetical:
| Initiative | Actual vs plan ($ millions) | Log entry cited | Classification |
|---|---|---|---|
| Procurement contracts | (0.3) | "Two supplier agreements signed 22 September instead of 1 September" | Timing |
| Hosting optimization | (0.2) | "Workload migration paused until support budget is approved" | Timing only if the hosting support decision due 30 September is approved |
| Cross-sell contribution | (0.2) | None | Cause not recorded; ask the Commercial VP |
Place the commentary beside the numbers, never in place of them. Timing items get a date by which the benefit must appear. Structural items move into the forecast and the next investment review. Unexplained items go back to their owner before the pack goes out. "Cause not recorded" is a correct answer. If revenue is below plan and no log explains why, a plausible story about customer churn is not evidence that churn caused the miss.
The one check that matters: Finance ticks every number in the commentary back to its cell. A number that is not in the workbook means the commentary did its own arithmetic, and that paragraph is rejected.
Make every exception trigger an action
Each exception needs an explanation, an owner, an action, a due date, and an expected effect. A red milestone is useful when it triggers a change in resources or scope. A green milestone is questionable until the person who depends on it has accepted it as complete.
Report stopped deals alongside closed ones: the money spent, why the deal stopped, when the decisive evidence emerged, and what should change in future screening. Avoid incentives based mainly on closings, presentation counts, or gross pipeline value. They can reward volume at the expense of capital discipline.
Continue with Board Reporting for executive communication and Value Creation Planning for defining and owning initiative-level benefits.
© 2026 CorpDev.Ai Unified Process for M&A