
DCF Analysis & Intrinsic Valuation
A discounted cash flow (DCF) model turns a view of how a business will operate into a value. Its worth lies in exposing the assumptions: what customers buy, what it costs to serve them, how much capital growth consumes, and which economics can last. A precise output cannot rescue unsupported assumptions.
For an acquisition, build the target's standalone case first. Add the buyer's planned changes separately, so the committee can see how much of the price depends on what the buyer does after closing.
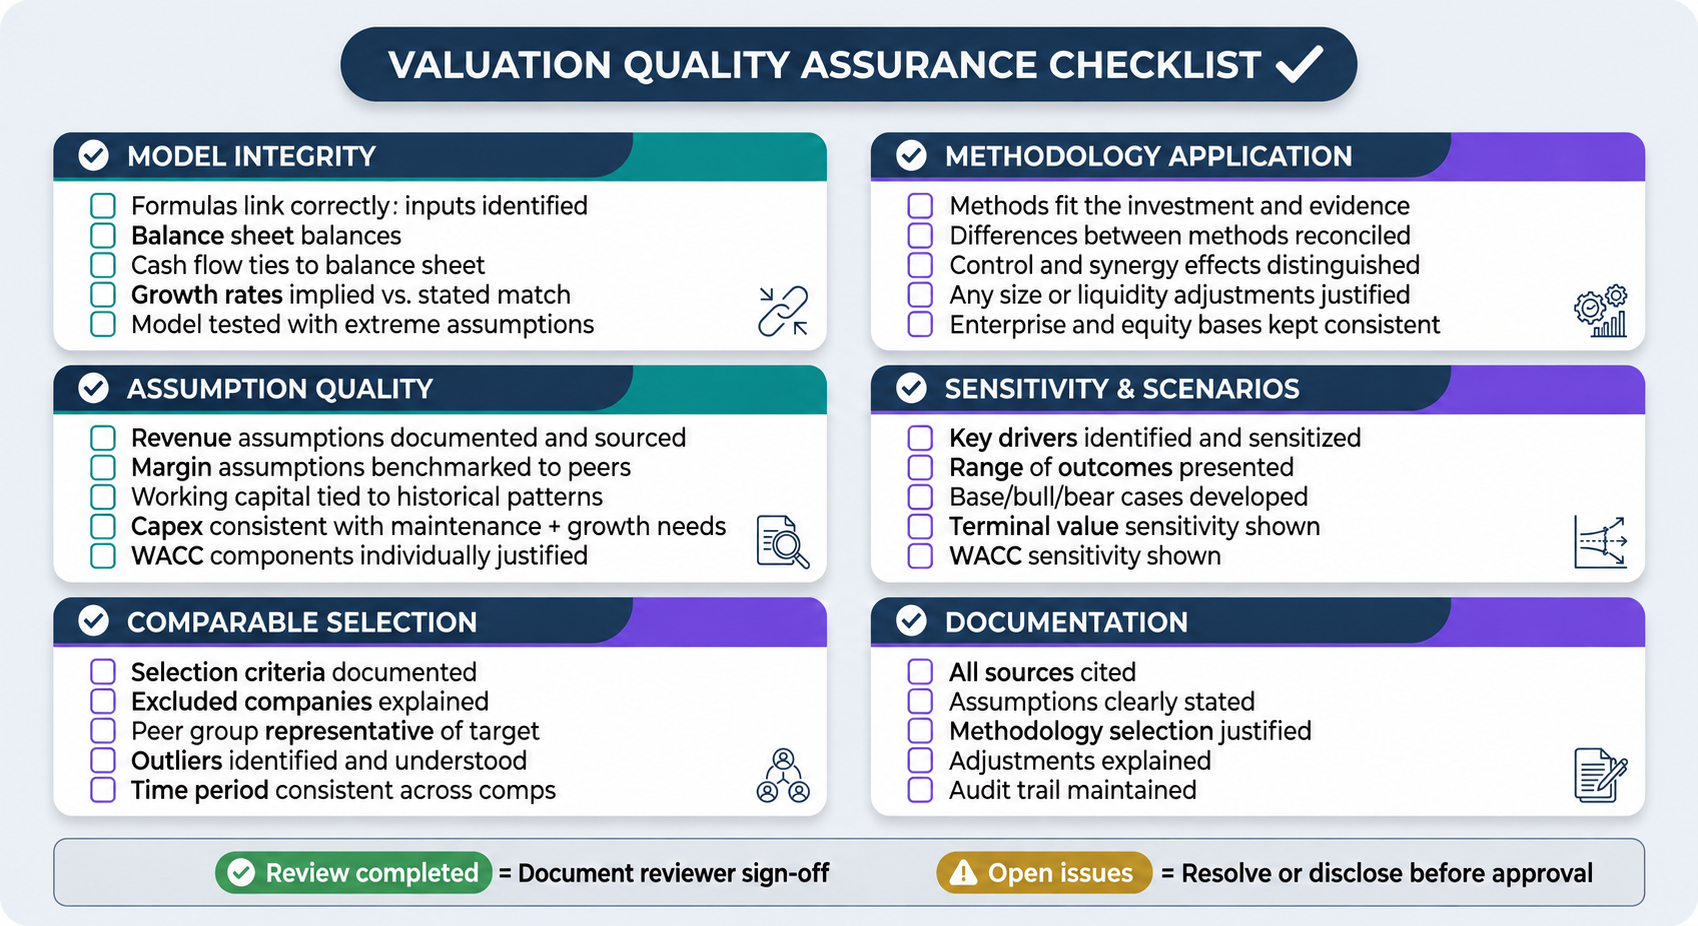 Model integrity ↗Assumption quality ↗Comparable selection ↗Methodology application ↗Sensitivity and scenarios ↗Documentation ↗Review before presentation ↗
Match the cash flow to the discount rate
Discount unlevered free cash flow, the cash available to all providers of capital, at the weighted average cost of capital (WACC). Discount cash flow to equity at the cost of equity. Mixing the two gives an inconsistent value. See Aswath Damodaran's explanation of valuation approaches.
State the valuation date, currency, nominal or real basis, forecast period, and timing convention. Use the same currency and inflation basis in the cash flows and the discount rate. Spell out how leases, pension obligations, noncontrolling interests, and other claims are handled, and treat them the same way throughout.
Forecast from what drives revenue and cost
Never start with a growth percentage and copy it across five years. Identify what produces the revenue and what limits it. The table lists the drivers to forecast, the evidence behind each, and the question that tests it.
| Driver | Evidence to obtain | Challenge to the forecast |
|---|---|---|
| Volume | Customers, units, utilization, capacity, or contracts by cohort | What must be won, retained, or delivered? |
| Price and mix | Realized prices, discounts, product mix, renewal terms | Does the plan assume price increases without churn or mix effects? |
| Gross margin | Unit costs, delivery effort, supplier terms, product economics | Are the efficiencies funded and practical? |
| Operating expense | Hiring, sales capacity, product roadmap, support requirements | Does growth require costs missing from the plan? |
| Capital spending | Maintenance needs, expansion projects, useful lives | Is the asset base being sustained as well as expanded? |
| Working capital | Receivables, inventory, payables, seasonality, collections | Does growth consume cash before earnings appear? |
Reconcile the model to historical reported results and to the quality-of-earnings adjustments. Keep management's forecast, the buyer's underwritten case, and the downside scenarios separate.
Calculate the cash the business generates before financing
A common formula:
Unlevered free cash flow
  = EBIT × (1 − operating cash tax rate)
  + depreciation and amortization
  − capital expenditure
  − increase in operating net working capital
Adapt this simple version for actual tax payments, other noncash items, leases, and cash flows specific to the business. Never deduct interest in the cash flow while also using a WACC that reflects financing. Adding back depreciation does not make the assets free; sustaining investment still consumes cash.
Build schedules for working capital, capital expenditure, and tax rather than typing in plugs. If working capital releases cash in the terminal year, explain the operating reason.
Discount each cash flow exactly once
With year-end discounting and a constant WACC:
Enterprise value of operating assets
  = Σ [FCF_t / (1 + WACC)^t] + TV_n / (1 + WACC)^n

Perpetuity-growth terminal value at the end of year n
  = FCF_(n+1) / (WACC − g)
Discount each forecast cash flow once, and the terminal value once, from the date it is measured. Never discount a present value a second time. For a perpetuity-growth terminal value, WACC must exceed the growth rate g, and the terminal cash flow must reflect economics the business can sustain. Damodaran's DCF teaching notes set out the framework for valuing the whole firm.
Worked example: where the value comes from
The following figures are hypothetical, in millions. Assume a 10% WACC, 2% perpetual growth, year-end cash flows, and a normalized year-three cash flow that supports the terminal assumption.
| Period | Free cash flow | Discount factor | Present value |
|---|---|---|---|
| Year 1 | 10.00 | 0.9091 | 9.09 |
| Year 2 | 12.00 | 0.8264 | 9.92 |
| Year 3 | 14.00 | 0.7513 | 10.52 |
| Terminal value | 178.50 | 0.7513 | 134.11 |
Year 4 FCF = 14.00 × 1.02 = 14.28
Terminal value = 14.28 / (10% − 2%) = 178.50
Operating enterprise value ≈ 163.64
Terminal value is about 82% of the total. That concentration is a reason to challenge the steady-state assumptions and show sensitivities. It is not evidence that the business is worth exactly $163.64 million.
Check that the terminal year can last forever
A business cannot grow forever without the investment that growth requires. Check that terminal margins, taxes, reinvestment, working capital, and returns on capital fit together. A terminal cash flow with expanding margins and no sustaining capital spending is a common hidden source of overvaluation.
If you use an exit multiple instead, explain the metric, the year it applies to, the peer basis, and why it fits the terminal growth and risk. An exit multiple brings an assumption about future market prices into the DCF. It does not remove the need to defend the economics.
Test the main operating drivers, not only WACC and terminal growth. A two-way table of discount rates can hide the fact that customer retention or capital spending drives most of the uncertainty.
Run a reverse DCF on the asking price
A forward DCF starts with a forecast and ends with a value, which tempts a team to tune the forecast until the value supports the deal. A reverse DCF runs the other way. It fixes the discount rate, terminal assumptions, and reinvestment, sets enterprise value equal to the asking price, and solves for the growth and margins that price requires. A price that needs growth the company has never achieved is a negotiating fact, not a modeling opinion.
Run the solves in the workbook. Hold margins fixed when solving for growth, then hold growth fixed when solving for margin. A two-way table shows combinations of the two; preserve the approved discount rate and other assumptions.
In a hypothetical case, last year's revenue was $100 million at an 18% EBITDA margin. Revenue grew 4–8% a year over five years (6% on average), and margins ranged from 16% to 18%. The workbook uses a 10% WACC, 2% terminal growth, and a 25% cash tax rate. Depreciation is 3% of revenue, capital spending 4%, and working capital 10%. Margins move in a straight line to the year-five level, which holds in the terminal year, and cash flows are discounted at year-end. The hypothetical results are:
| What the $200m price requires | Solved in the workbook | What the business has delivered |
|---|---|---|
| Revenue growth in years 1–5, margin held at 18% | 13.5% a year | 4–8% a year; 6% on average |
| Year-5 EBITDA margin, growth held at 6% | 23.1% | 16–18% |
| Year-5 EBITDA margin if growth reaches 9% | 20.8% | Growth never reached 9%, nor the margin 20% |
| Value if the track record simply continues | $150m | The price is 33% higher |
The asking price needs the business to more than double its growth rate, or to add five points of margin it has never earned. Perhaps the seller can show a step change, such as signed contracts or a price rise customers have accepted; if so, diligence should test it. If not, the price already hands the seller value that only the buyer can create. The one check that matters: confirm the solve runs through the same model as the forward DCF, so faster growth also consumes more working capital and capital spending. A reverse DCF that lets growth arrive without investment makes any price look easier to justify.
Bridge to equity value and the purchase price
To reach equity value, add nonoperating assets not already valued and subtract debt and other relevant claims, using a clearly defined bridge. Reconcile the cash treatment with the purchase agreement. Never count operating cash twice, once in forecast working capital and again as excess cash added to value.
Compare the standalone value with the proposed enterprise purchase price. Then show separately the present value of buyer synergies, implementation costs, dis-synergies, and any additional taxes or capital needs. The buyer should keep enough value to cover the risk and to beat other uses of capital. The fact that synergies exist does not entitle the seller to all of them.
Turn each diligence finding into a model change
Keep an assumptions register with each assumption's source, date, owner, confidence, and the evidence still needed. When diligence changes an assumption, update the schedule it affects and explain the effect on value.
A downside case should describe a business outcome that could really happen: slower customer wins, delayed capacity, lower retention, or higher delivery costs. Never apply a flat cut to every line without explaining how the lines connect. Look for risks that move together. A delayed product, for example, can cut revenue and raise development spending at the same time.
Check ten points before committee
- Historical figures reconcile to the source financials and the adjustment schedule.
- Forecast growth is explained by volume, price, or customers.
- Margin changes have owners, costs, and timing.
- Capital spending and working capital support the growth assumed.
- Cash flow, discount rate, currency, and timing convention match.
- Terminal value uses a sustainable cash flow and a defensible growth rate or multiple.
- Adjustments from enterprise value to equity value are complete and counted once.
- Synergies and integration costs are shown separately from standalone value.
- Sensitivities identify the assumptions that could change the decision.
- A reviewer can reproduce the output from the documented inputs.
Present a range and the conditions that support it. The committee is not asking whether the spreadsheet calculates. It is asking whether the company should commit capital, given the evidence and the alternatives.
Continue with valuation methods, comparable companies, and valuation review.
© 2026 CorpDev.Ai Unified Process for M&A